Should you wait for new lows or new highs?
There are two ways to wait. One saver buys only when the market reaches a new low. The other buys only when it reaches a new high. Until then, both leave their monthly savings in cash.
I measure what each rule costs. I test both on the S&P 500 against a saver who buys every month, across every ten-year saving plan since 1991, and report the difference in annual return. Waiting for a new 12-month low cut the median annual return by 1.67 percentage points and never beat buying every month in any of the 306 plans. Waiting for a new 12-month high cut it by 0.58 points.
Step 1. Three series
I use three series. First, the S&P 500 price index, because I define a new high and a new low on the price index rather than on the total-return index. Second is the total-return index, which includes dividends because that is what we earn when invested. Third, the 13-week T-bill rate, the interest rate on short-term US government debt, less 0.75 percentage points, a rough proxy for a savings account when not invested in the S&P 500.
Pulling them is a separate job that depends on the data vendor. I pull the total-return index from LSEG Workspace, which is licensed, and the price index and the 13-week T-bill rate from Yahoo Finance. The raw files and the download code stay off this page. Any source with S&P 500 price and total-return history and a short T-bill series will do.
Everything below runs off one in-memory table, d, with one row per calendar month indexed by month:
px, the price index at the month-end close.mkt, the monthly total return, dividends included.rf, the T-bill rate less 0.75 percentage points and never below zero, as a monthly decimal, lagged one month so the rate is known before it is earned.
The sample runs from February 1988 through June 2026, 461 months. I stop at the last complete month, since a partial month reduced to a month-end value would enter the test as if it were finished. Cash averages 2.38% a year over that span.
Step 2. The structure
The issue is that a new low or a new high has no meaning until I choose how far back to look. I test every window length N from 1 to 36 months. A new N-month low means this month’s close is the lowest of the last N months. A new N-month high means it is the highest. The window includes the current month, so at N = 1 every month is both a high and a low. Both rules then buy every month and must match the control exactly.
Then, once a month, invested money earns the market return and waiting cash earns the cash rate. This month’s saving then goes into cash. If the rule says buy, the entire cash balance moves into the market.
Both rules use the close of month t and buy at that same close. The money therefore earns its first market return in month t+1.
I test every possible ten-year plan. In one long run, a dollar contributed in 1991 compounds for decades, while one contributed in 2024 compounds for a small fraction of that time. The result would therefore be mostly about the beginning of the sample. With ten-year plans, every starting month gets the same amount of time.
The first plan begins only after the 36-month rule has enough history. This means that a 3-month rule and a 36-month rule are tested over exactly the same months.
import numpy as np                          # arrays and math
import pandas as pd                         # tables and dates

LOOKBACKS = range(1, 37)                    # a new low/high over the last 1 to 36 months
HORIZON = 120                               # one saving plan is 120 months = 10 years
CONTRIB = 1.0                               # saved every month; results are per unit contributed

# The longest rule looks back 36 months, so the test begins 36 months into the sample.
# Every rule is then measured over one and the same set of months.
warmup_months = max(LOOKBACKS)
evaluation_months = d.index[warmup_months:]

# .loc selects rows by their month label. .to_numpy() then drops the labels and leaves a
# plain array, which the saving plan below walks through by position.
market_return = d.loc[evaluation_months, "mkt"].to_numpy()
cash_return = d.loc[evaluation_months, "rf"].to_numpy()

n_months = len(evaluation_months)

# A plan needs a full 120 months. range stops one short of its end value, so the +1 keeps
# the last month from which a complete plan still fits.
plan_starts = range(0, n_months - HORIZON + 1)
Three functions do the work. new_high_months and new_low_months mark the months in which each rule lets the saver buy. run_plan then walks one saving plan month by month.
def new_high_months(n):
    """True in every month whose close is the highest of the last n months."""
    price = d["px"]

    # rolling(n) covers this month and the n - 1 before it. The test is >= rather than >,
    # so a month that merely equals the earlier best still counts, which is why every month
    # counts at n = 1.
    highest_close = price.rolling(n).max()
    is_new_high = price >= highest_close
    return is_new_high.loc[evaluation_months].to_numpy()


def new_low_months(n):
    """True in every month whose close is the lowest of the last n months."""
    price = d["px"]
    lowest_close = price.rolling(n).min()
    is_new_low = price <= lowest_close
    return is_new_low.loc[evaluation_months].to_numpy()


def run_plan(rule_fires, start):
    """One saving plan: save every month for HORIZON months, beginning at month start."""
    invested = 0.0
    cash = 0.0

    for i in range(start, start + HORIZON):
        invested = invested * (1 + market_return[i])   # invested money earns the market
        cash = cash * (1 + cash_return[i])             # waiting money earns the cash rate
        cash = cash + CONTRIB                          # this month's saving arrives

        if rule_fires[i]:
            # The rule allows a purchase, so the whole cash balance moves into the market
            invested = invested + cash
            cash = 0.0

    return invested + cash


print(f"{len(plan_starts)} plans, first starts {evaluation_months[0]}"
      f", last ends {evaluation_months[-1]}")
306 plans, first starts 1991-02, last ends 2026-06The block prints the number of ten-year plans, 306, the first starting in February 1991 and the last ending in June 2026. The rolling window behind new_high_months and new_low_months is covered in Lesson 19, and the one-month lag on the cash rate in Lesson 20.
Step 3. From the final pot to an annual return
Money goes in every month. The compound annual growth rate (CAGR) assumes one starting amount that is left to grow, so I use the internal rate of return (IRR) for this test. IRR is the constant return that would turn the 120 monthly contributions into the final pot. I first find the monthly rate and then convert it to an annual one.
There is no simple formula that gives the rate directly, so I find it by bisection. I start with a low rate and a high rate, test the midpoint, and keep the half that contains the answer. Repeating this narrows the range until only one rate remains.
def irr(final_pots):
    """Annual IRR for a whole array of final pots, by bisection on all of them at once."""
    final_pots = np.asarray(final_pots, float)

    # Bisection needs one rate below the answer and one above it. The search runs on
    # monthly rates, and it starts from a wide bracket of minus 50% to plus 50% a month.
    low_rate = np.full(final_pots.shape, -0.5)
    high_rate = np.full(final_pots.shape, 0.5)

    for _ in range(60):                                  # 60 halvings is plenty
        mid_rate = (low_rate + high_rate) / 2

        # The annuity formula divides by the rate, and np.where works out both of its
        # branches before choosing between them. The divisor therefore has to be replaced
        # before the division happens, and a zero rate takes the plain sum instead.
        rate_is_zero = np.abs(mid_rate) < 1e-12
        safe_rate = np.where(rate_is_zero, 1.0, mid_rate)
        pot_at_mid_rate = np.where(rate_is_zero,
                                   CONTRIB * HORIZON,
                                   CONTRIB * ((1 + mid_rate) ** HORIZON - 1) / safe_rate)

        # Where the real pot beats what the midpoint rate would deliver, the true rate has
        # to be above the midpoint, so the upper half of the bracket is the half to keep.
        true_rate_is_higher = pot_at_mid_rate < final_pots
        low_rate = np.where(true_rate_is_higher, mid_rate, low_rate)
        high_rate = np.where(true_rate_is_higher, high_rate, mid_rate)

    monthly_rate = (low_rate + high_rate) / 2
    return (1 + monthly_rate) ** 12 - 1                  # monthly rate to annual


buy_every_month = np.ones(n_months, bool)       # the control: buy every single month

control_pots = []
for start in plan_starts:
    control_pots.append(run_plan(buy_every_month, start))

control_irr = irr(control_pots)

print(f"buying every month: median {np.median(control_irr):.2%} a year, "
      f"worst plan {control_irr.min():.2%}, best {control_irr.max():.2%}")
buying every month: median 10.26% a year, worst plan -7.89%, best 17.49%Buying every month returned a median of 10.26% a year, the middle value when the plans’ returns are sorted. Depending on the starting month, the annual return ranged from -7.89% to 17.49%. A single long backtest reports one number instead of that range.
So, I compare each rule with the control over the same ten years, plan by plan. For each rule and each N, I take the median of the 306 differences.
Step 4. Every rule, every window, every plan
At N = 1, both rules buy every month and must match the control. The assertion checks that.
comparison_rows = []

for n in LOOKBACKS:
    both_rules = (("Only at new lows", new_low_months(n)),
                  ("Only at new highs", new_high_months(n)))

    for rule_name, rule_fires in both_rules:
        rule_pots = []
        for start in plan_starts:
            rule_pots.append(run_plan(rule_fires, start))

        # Each plan is compared with the control plan that ran over the same ten years, so
        # both plans use the same market returns. Times 100 turns a decimal return into points.
        difference_in_points = (irr(rule_pots) - control_irr) * 100

        median_difference = np.median(difference_in_points)                    # the typical plan
        share_that_won = (difference_in_points > 0).mean() * 100        # share of plans that won

        comparison_rows.append({"rule": rule_name,
                                "n": n,
                                "median_difference": median_difference,
                                "beat": share_that_won})

results = pd.DataFrame(comparison_rows)

# At n = 1 every month is both a new high and a new low, so both rules have to reproduce
# the control exactly. Anything else means the engine above is wrong.
cost_at_one_month = results.loc[results["n"] == 1, "median_difference"]
assert np.allclose(cost_at_one_month, 0, atol=1e-9), "engine is wrong at n = 1"

SHOWN_LOOKBACKS = [1, 3, 6, 12, 13, 14, 18, 24, 36]

# pivot turns the long table into one row per window and one column per rule
cost_table = results.pivot(index="n", columns="rule", values="median_difference")
print(cost_table.round(2).loc[SHOWN_LOOKBACKS].to_string())
rule Only at new highs Only at new lows
n
1 0.00 0.00
3 -0.24 -0.52
6 0.10 -1.00
12 -0.58 -1.67
13 -0.62 -1.67
14 -0.62 -2.98
18 -0.77 -5.12
24 -1.11 -5.58
36 -1.17 -3.85Waiting for lows cost the most. A 12-month low reduced annual return by 1.67 percentage points and did not beat the control in any of the 306 plans. At 24 months, the reduction was 5.58 percentage points.
Waiting for highs cost much less. A 12-month high reduced annual return by 0.58 points. At six months, the rule added 0.10 points.
import matplotlib.pyplot as plt

fig, ax = plt.subplots(figsize=(10, 6))
ax.axhline(0, color="#666666", lw=1.2)                    # the control

# max(LOOKBACKS) puts the label at the right-hand end of the zero line
ax.annotate("buy every month", (max(LOOKBACKS), 0), xytext=(0, 7),
            textcoords="offset points", ha="right", color="#666666")

for rule_name, colour in (("Only at new lows", "#C44E52"),
                          ("Only at new highs", "#4C72B0")):
    one_rule = results[results["rule"] == rule_name].sort_values("n")
    ax.plot(one_rule["n"], one_rule["median_difference"], "-o",
            color=colour, lw=2, ms=5, label=rule_name)

ax.set_xlabel("New high / low over the last N months")
ax.set_ylabel("Difference in annual IRR (percentage points)")
ax.set_title("The price of waiting")
ax.legend(frameon=False, loc="lower left")
ax.grid(color="#dddddd", lw=0.7)
ax.set_axisbelow(True)                                    # gridlines behind the data
for side in ("top", "right"):
    ax.spines[side].set_visible(False)

plt.tight_layout()
plt.savefig("price_of_waiting.png", dpi=120, bbox_inches="tight")
plt.show()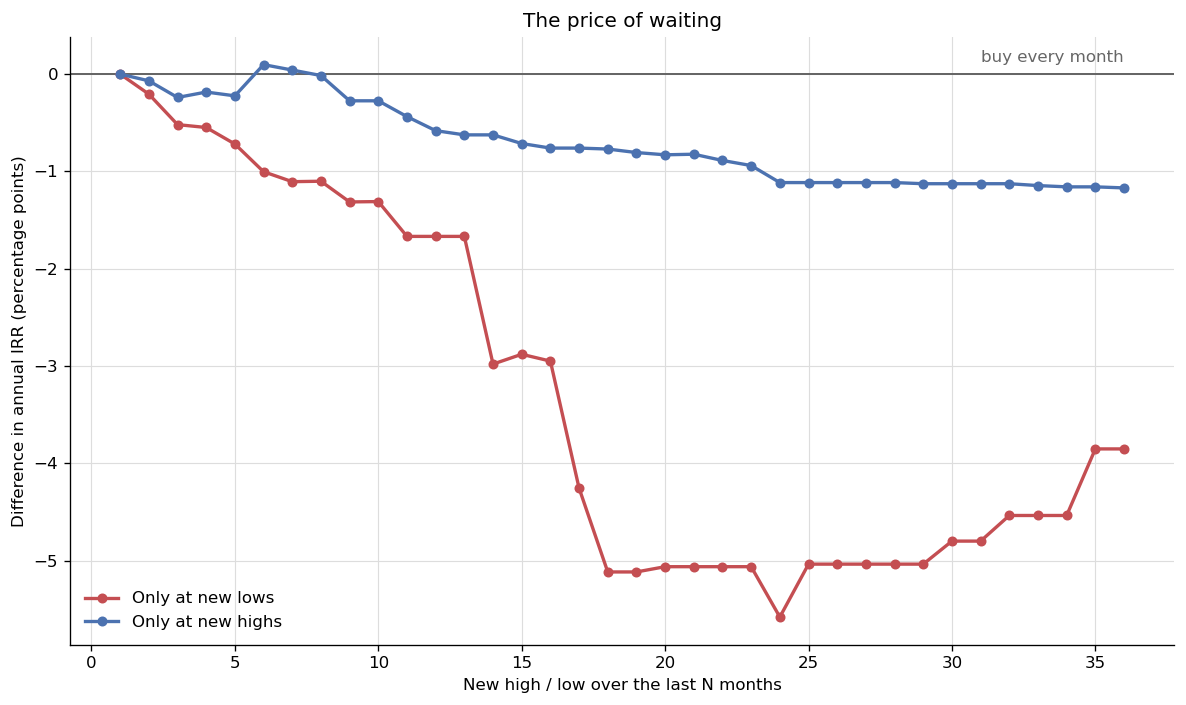
Both lines start at zero, as they should. The high rule stays close to the control and costs at most 1.17 points, at N = 36. The difference for the low rule decreases slowly through N = 13, decreases sharply to -5.12 points at N = 18 and -5.58 points at N = 24, and is -3.85 points at N = 36.
Step 5. The long waits
Between N = 13 and N = 14, the low rule’s median reduction in annual return increases from 1.67 to 2.98 percentage points a year. One extra month adds 1.31 points. A longer window can only remove buying months, and money that is not invested waits in cash until the next purchase. To show how long such a wait can last, I measure the longest run of months without a purchase for the low and high rules at 12 and 24 months.
def longest_wait(rule_fires):
    """The longest run of consecutive months in which the rule allowed no purchase."""
    wait_episodes = []
    months_waiting = 0
    wait_started_at = 0

    for i, fired in enumerate(rule_fires):
        if not fired:
            if months_waiting == 0:
                wait_started_at = i             # this month opens a new wait
            months_waiting += 1
        else:
            if months_waiting > 0:
                wait_episodes.append((months_waiting,
                                      evaluation_months[wait_started_at],
                                      evaluation_months[i - 1]))
            months_waiting = 0

    # A wait still open when the sample ends never meets a buying month, so the loop above
    # never records it. It is closed at the last month instead.
    if months_waiting > 0:
        wait_episodes.append((months_waiting,
                              evaluation_months[wait_started_at],
                              evaluation_months[-1]))

    # max compares tuples item by item, so the longest wait wins and a tie on length goes
    # to the one that started later.
    return max(wait_episodes)


for n in (12, 24):
    both_rules = (("low ", new_low_months(n)),      # the space keeps the printed lines aligned
                  ("high", new_high_months(n)))

    for rule_name, rule_fires in both_rules:
        months, first, last = longest_wait(rule_fires)
        print(f"{n:>2}-month {rule_name}: {months:>3} months ({months/12:.1f} years) "
              f"with no purchase, {first} to {last}")
12-month low : 76 months (6.3 years) with no purchase, 1994-07 to 2000-10
12-month high: 33 months (2.8 years) with no purchase, 2000-09 to 2003-05
24-month low : 208 months (17.3 years) with no purchase, 2009-03 to 2026-06
24-month high: 50 months (4.2 years) with no purchase, 2000-09 to 2004-10A 12-month low rule went 76 months without buying, from July 1994 through October 2000. A 24-month low rule went 208 months, or 17.3 years, without buying, from March 2009 until the sample ends in June 2026. That is longer than a ten-year plan, so some plans never entered the market.
The 2020 crash did not end the wait. The S&P 500 closed March 2020 about 3% above its December 2018 close, the lowest in the previous 24 months, so on monthly data March 2020 was not a new 24-month low. This test uses monthly closes. I do not test a daily rule.
Limitations
Whether a low is a good price. The test measures what it cost to wait. It does not measure whether the low was cheap. It combines the price paid with the time spent in cash and cannot separate the two.
One market, one history. The test covers the S&P 500 over one mostly rising period. That works against a rule that waits for lows. A long falling market could reverse the result. I do not test one.
The fill is idealised. The rule buys at the same close that identifies the new high or low. That price is not known until the close. The test therefore assumes a purchase at a price the saver could not have known in advance.
The windows overlap. Plans one month apart share 119 of their 120 months. The 306 plans are therefore not 306 independent experiments, and I do not calculate confidence intervals, ranges that likely contain the true values. Ten years is also a choice. A long wait matters more to a five-year saver than a twenty-year one. The plans never sell, and I ignore taxes.
Conclusion
At almost every N, waiting for a new high or low reduced the median annual return over ten years. The 12-month low rule never beat monthly investing. Apart from N = 1, the median difference in annual return was positive only for the high rule at six and seven months, as the chart shows. At six months it was 0.10 points a year, and at seven months it was smaller.
The largest costs came when the low rule went years without buying. In this sample, the later purchases did not recover the returns missed while the money waited in cash.
The takeaway is that the simplest rule is hard to beat: invest every month.
Disclaimer: This is a simplified, hypothetical backtest for discussion purposes only. Not investment advice. Past performance does not guarantee future returns.
Data: S&P 500 total-return index from LSEG Workspace, which is licensed and not reproduced here. S&P 500 price index and 13-week Treasury bill rate from Yahoo Finance.