How much growth is there in growth stocks?
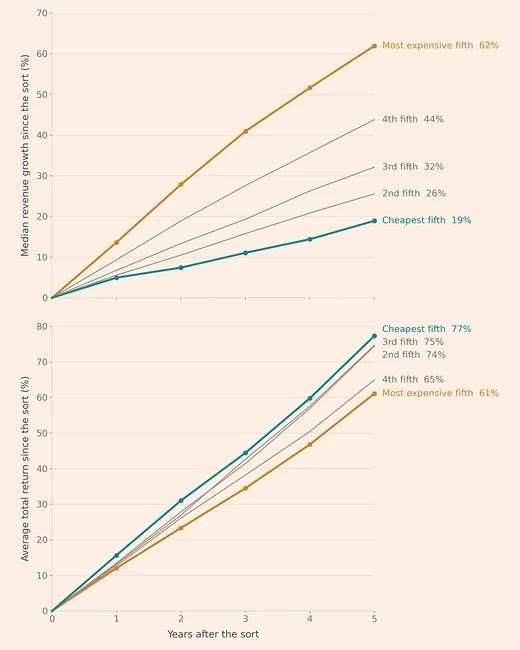
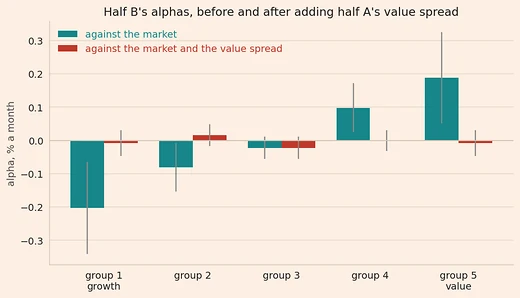
Sorted at year-ends 2001 to 2020, the most expensive fifth of large US stocks grew its revenue three times as fast as the cheapest fifth over five years, and returned less.
Backtests, data, and equity strategy ideas. Code when relevant. Readers who want to start from the foundations can use Practical Coding, where Python and R are taught.
Sorted at year-ends 2001 to 2020, the most expensive fifth of large US stocks grew its revenue three times as fast as the cheapest fifth over five years, and returned less.
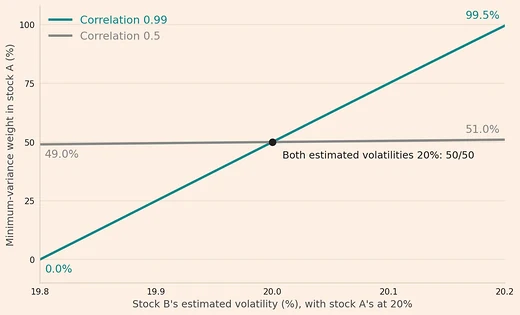
When two stocks move almost together, raising one stock's estimated volatility from 20% to 20.2% changes the other stock's minimum-variance weight from 50% to 99.5%.
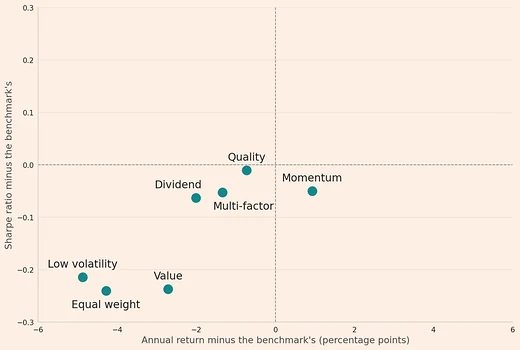
From November 2015 to September 2026, the funds of all seven smart beta strategies had a lower average Sharpe ratio than their cap-weighted benchmarks.
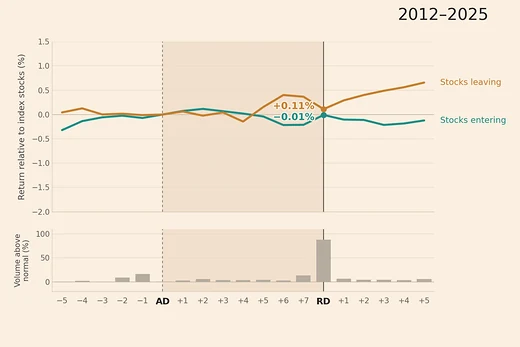
Over 2012 to 2025, stocks entering and leaving the MSCI USA Minimum Volatility Index returned about as much as its other stocks before the changes were implemented.
How to turn value and momentum into one score, select and weight 100 stocks, and rebalance them with trading costs, on simulated data.
How to go from an economic idea about a characteristic to the evidence that it is a factor, in five steps, with value on simulated data.
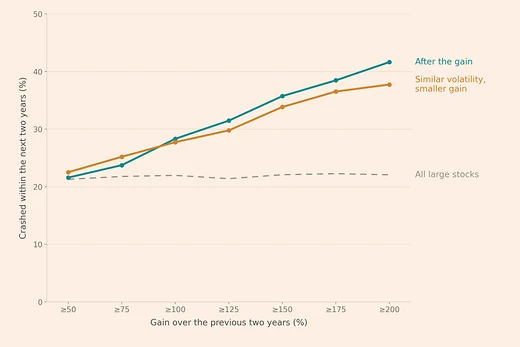
Large US stocks that had doubled crashed more often than large stocks in general, and about as often as large stocks with similar past volatility that had not doubled.
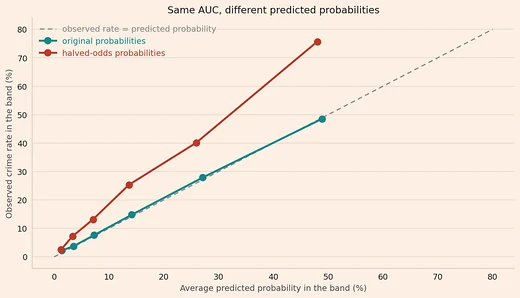
Halving every announcement's odds of a crime leaves the AUC unchanged, while the probabilities then add up to about half the crimes that occur.

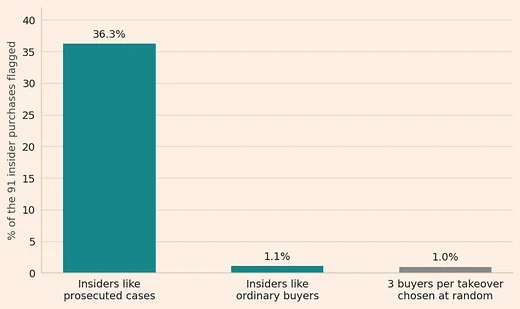
At a simulated broker, an isolation forest flags 36.3% of insider purchases that resemble prosecuted cases, and 1.1%, no better than chance, when insiders buy like ordinary buyers.
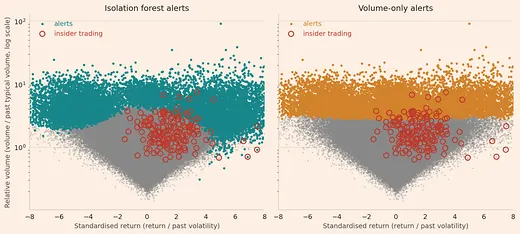
In a simulated market, an isolation forest flags only 6.4% of the days of illegal insider trading, because most of those days look like ordinary days.
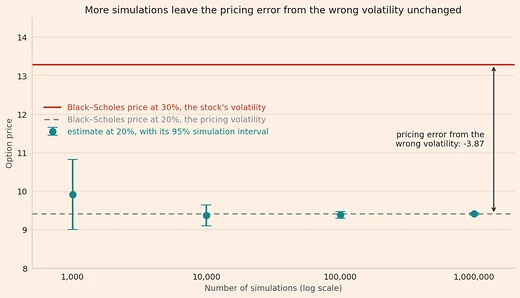
More simulations make an estimated option price more precise, but they leave the error from a wrong volatility input unchanged.
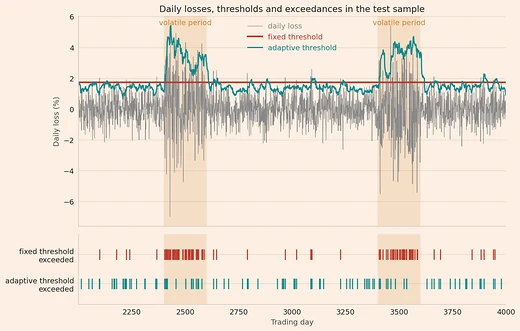
In a simulation, a daily loss forecast exceeded on 5% of all days, as intended, is exceeded on 20% of volatile days.
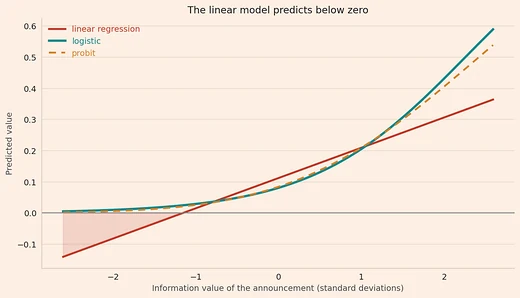
How to read logit and probit coefficients as changes in the probability of a crime.
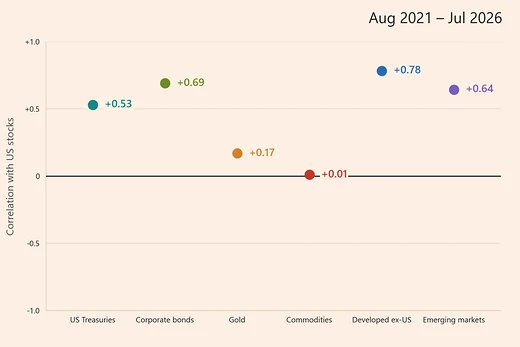
On monthly returns, US Treasuries had a correlation of -0.31 with US stocks over 2008 to 2013 and +0.53 over 2021 to 2026.
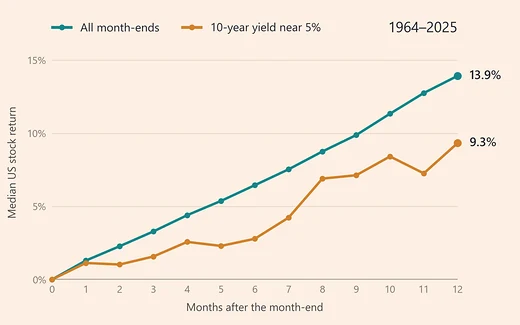
After the 10-year Treasury yield was near 5%, the median US stock return over the next year was lower, almost entirely because of 2000 to 2002.
How accuracy and the AUC differ, shown with two models that both have 99% accuracy on 100 traders but AUCs of 0.50 and 0.91.
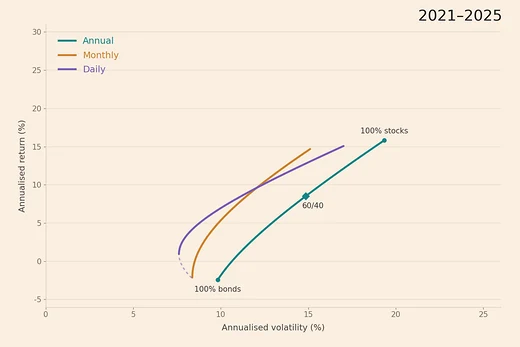
Measured on daily returns instead of the five annual returns the Financial Times used, a 60/40 portfolio's volatility over 2021 to 2025 is 10.94%, against 14.86%.
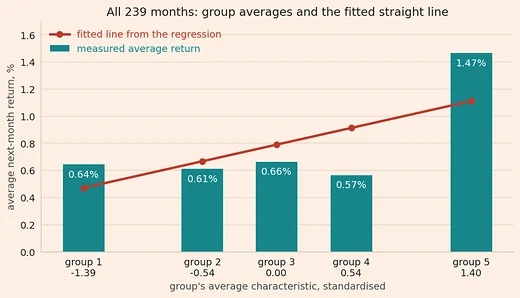
When only the top fifth of simulated stocks earns extra return, five group averages show it, and a straight line predicts more return at every step.
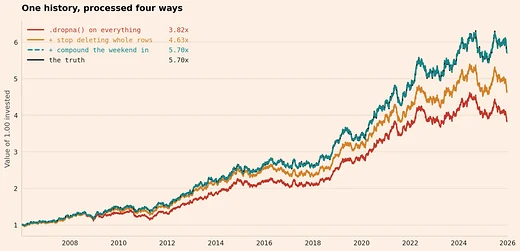
On a simulated four-asset portfolio, dropna() deletes returns that were never missing and cuts the backtest's final value by a third.
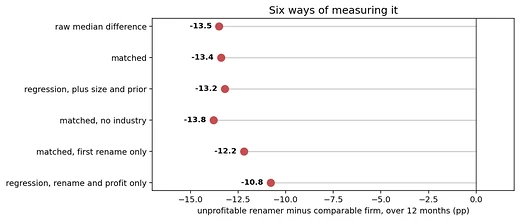
Unprofitable firms that changed their name trailed comparable firms by about 13 percentage points over the next year, and profitable ones did not.
On simulated data with a real edge, at least one of ten ordinary changes in how the portfolio is built flips the trading decision in 79% of datasets.
Five of the six biases make a worthless result look valuable, and one makes a good strategy look bad.
The tuned strategy has a Sharpe ratio of −0.2 on a final test used once, because tuning against a hold-out fits the hold-out's noise.
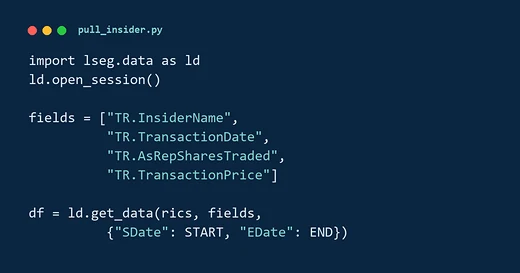
A Python script that downloads insider transactions for about 10,000 US stocks from LSEG and resumes after an interruption.
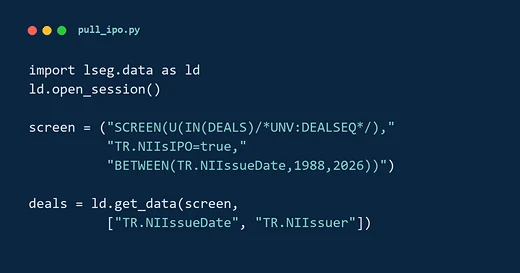
A Python script that downloads every US IPO since 1988 from LSEG, delisted companies included, and keeps the operating companies.
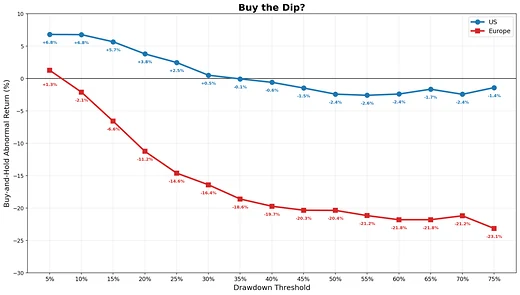
Buying the dip, net of costs, roughly matched the market over the next year in the US, and in Europe trailed it after falls of 10% or more.
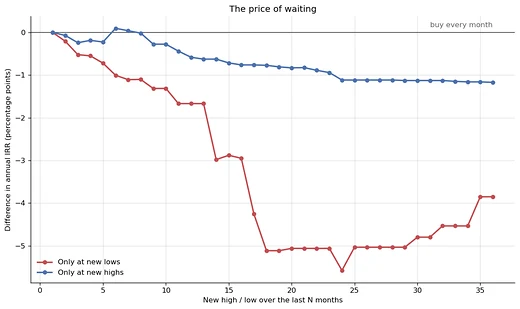
Waiting for new S&P 500 highs or lows to invest usually earned less over ten years than investing every month.
How to connect Python to Interactive Brokers with ib_async and download a year of daily prices into pandas.
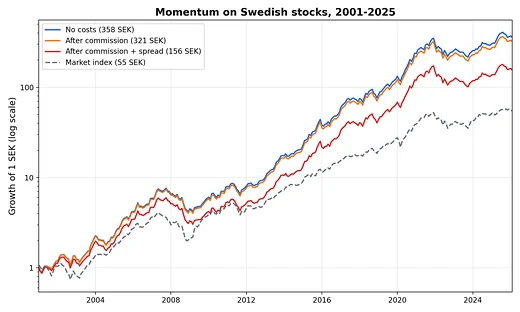
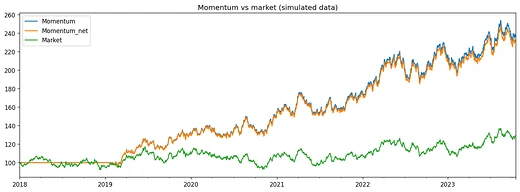
From 2001 to 2025, trading costs cut one krona's growth in Swedish momentum from 358 kronor to 156, still ahead of the market's 55.
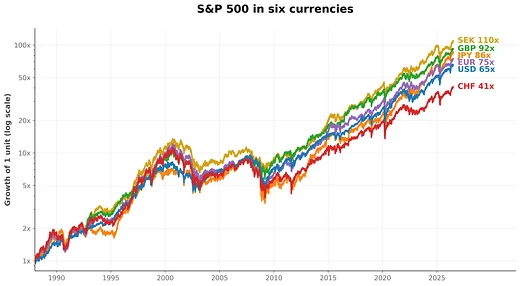
From 1988 to 2026, the S&P 500 multiplied an unhedged investment 109.7 times in Swedish kronor and 41.1 times in Swiss francs.
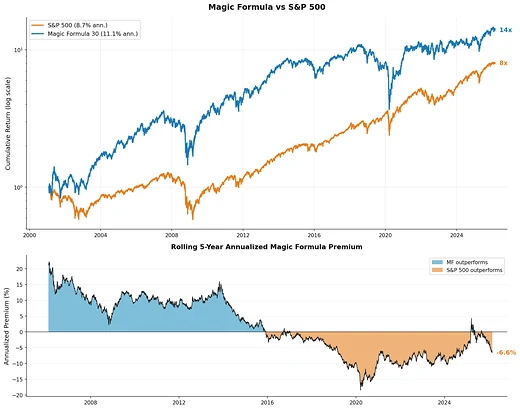
Greenblatt's Magic Formula returned 11.1% a year after trading costs, against 8.7% for the S&P 500 from 2001 to 2026, and has trailed it since about 2015.
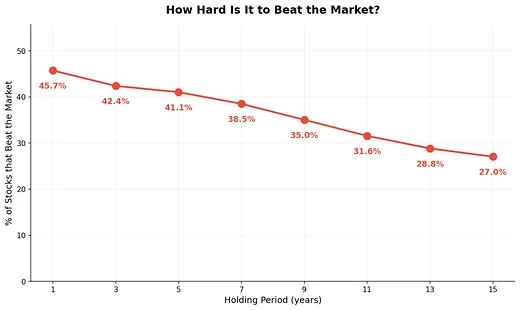
From 2000 to 2026, 45.7 percent of US stocks beat the S&P 500 over one year, and 27.0 percent over fifteen years.
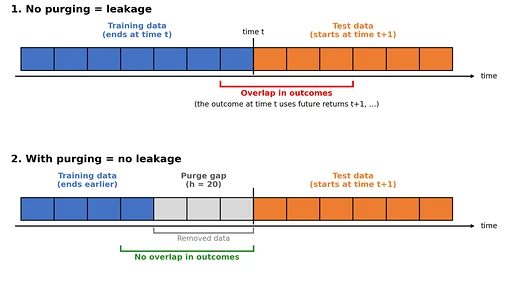
Training labels that reach into the test period raise a model's accuracy on returns with no signal to 90.5%, and dropping those training days gives 50.3%.
In a simulated market with no edge, the best of 216 strategies has a Sharpe ratio of 0.72, which searching alone matches or beats 41% of the time.
A Python script that downloads every trade and quote for a list of stocks from LSEG Tick History and restarts where it stopped.
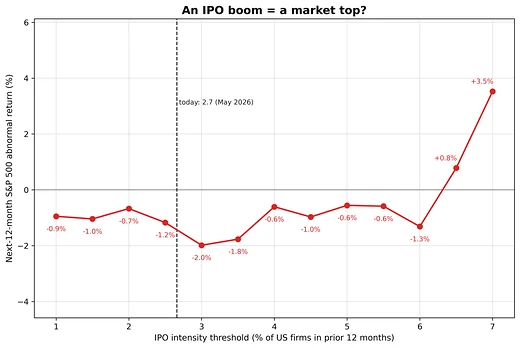
From 1988 to 2025, an IPO boom was no stable warning: in the following year the S&P 500 returned within a few points of its average.
Two unrelated simulated price series have a correlation of 0.93 because both trend upward, and a cointegration test finds no evidence of a stable relation.
Five rules from Jacobsen and McCloskey for stating your point directly, each with an example before and after.
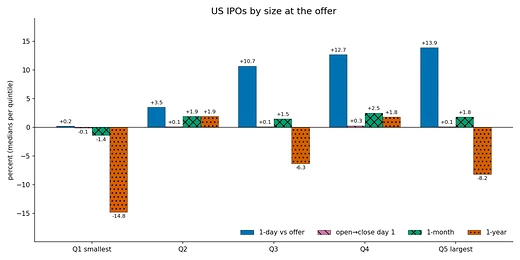
Sorted by price-to-earnings ratio at the offer, the cheapest quarter of profitable US IPOs returned a median 13.0% in its first year, against −2.1% for the priciest.
At the 2014, 2018 and 2022 World Cups, Elo ratings predicted how often the favourite won, counting a draw as half, to within 3 percentage points.
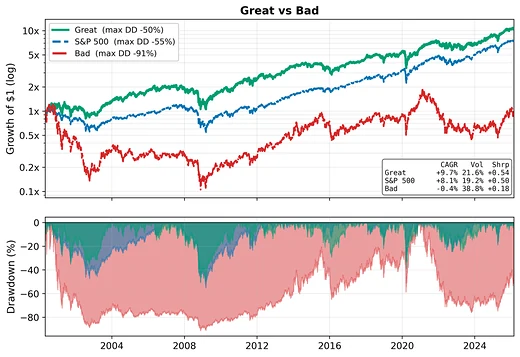
From 2000 to 2026, the 30 most profitable US companies returned 9.7% a year after costs, against 8.1% for the S&P 500 and −0.4% for the 30 least profitable.
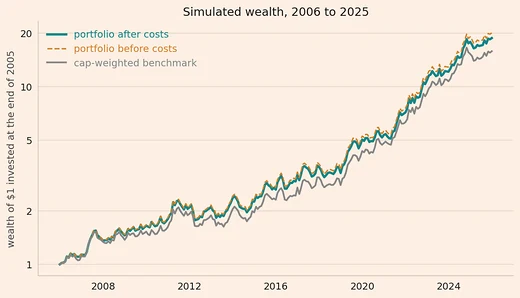
A monthly momentum strategy backtested end to end in Python with the bt library, on simulated data, before and after trading costs.
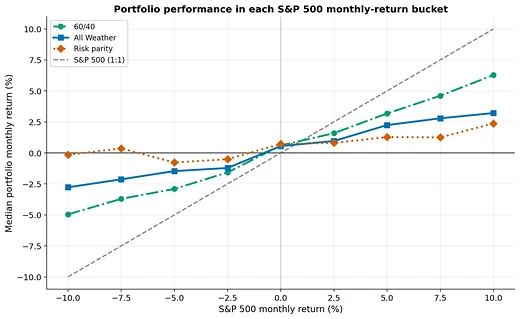
From 1988 to 2026, three diversified portfolios typically lost less than the S&P 500 in its falling months and gained less in its rising months.
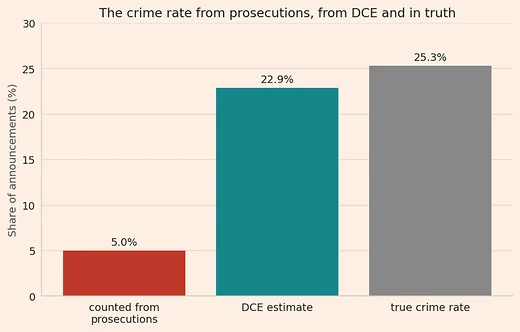
From a prosecution rate of 5%, Detection-Controlled Estimation estimates a crime rate of 23%, where the simulated true rate is 25%.
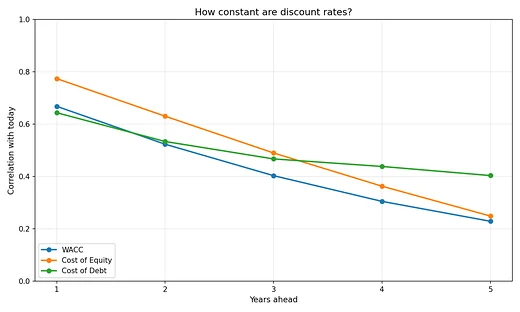
Across US firms, the correlation between a firm's cost of capital today and one year later averages 0.67, and five years later 0.23.
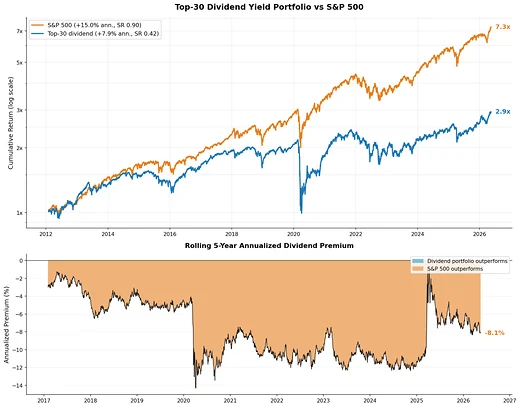
The 30 highest-yielding US stocks returned 7.9% a year after trading costs from 2012 to 2026, against 15.0% for the S&P 500.
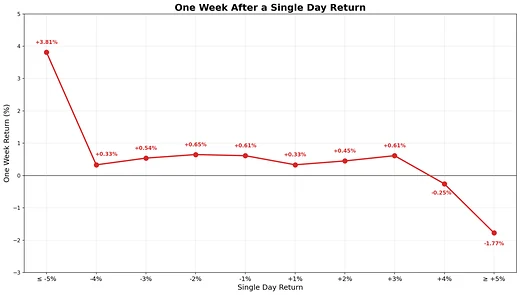
The S&P 500's median next-week return was far from zero only after one-day moves of 5% or more, and opposite in sign to those moves.
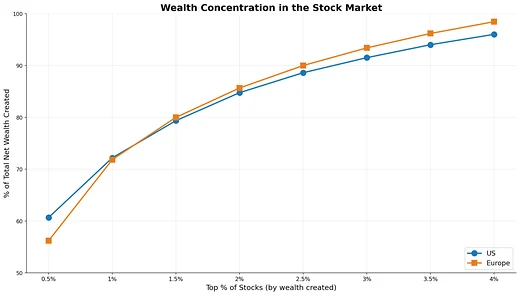
From 2000 to 2026, 5.4% of US stocks and 4.4% of European stocks created all the net wealth, the total gain above Treasury bills, repeating Bessembinder's finding.
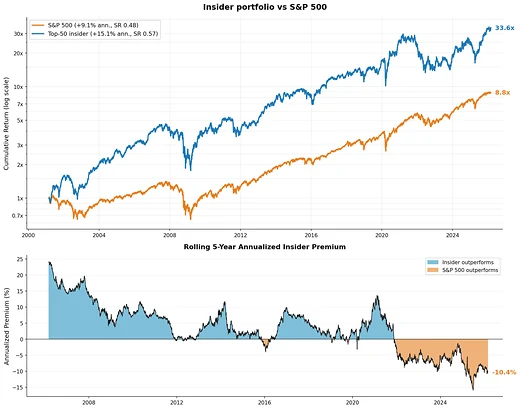
Following insider buyers beat the S&P 500 from 2001 to 2026 after costs, 15.1% a year against 9.1%, and trailed it over the last five years.
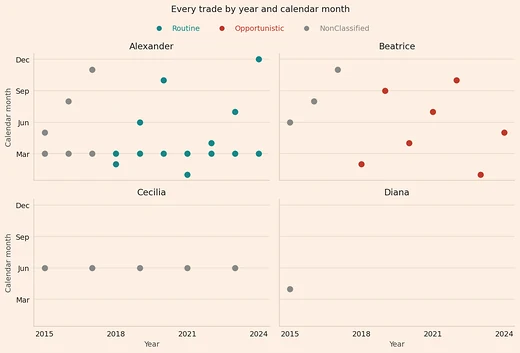
How to label an insider routine or opportunistic in Python, from the calendar months of their trades over the three previous years.
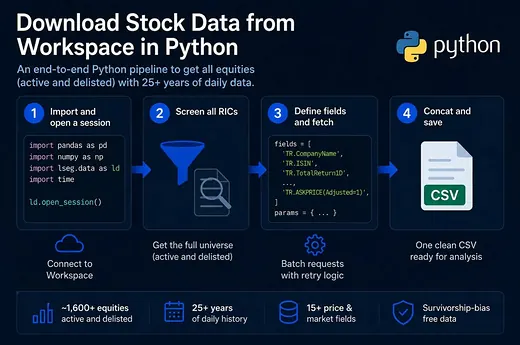
A Python script that downloads daily data since 2000 for about 1,650 Swedish stocks from LSEG, delisted ones included, into one CSV.