Just 4% of stocks created nearly all the wealth
Just 4% of stocks created nearly all the wealth in the stock market. Bessembinder (2018) found that the best-performing 4.3% of US stocks accounted for all of the net wealth the market created over Treasury bills from 1926 to 2016. The remaining stocks, taken together, matched one-month bills.
I test whether that concentration holds on modern data, for US and European stocks from 2000 to 2026. It does. The top 5.4% of US stocks account for 100% of net wealth created. In Europe the top 4.4% do the same.
The largest wealth creators are the mega-caps. Apple, Nvidia, Alphabet, and Microsoft lead the US list. Shell, HSBC, and BHP lead the European one. Slightly more than half of US stocks beat T-bills over their life in the sample, 5,611 of 10,061, or 55.8%. In Europe fewer than half did, 4,629 of 9,862, or 46.9%.
The method
- Universe: US common stocks on NYSE and Nasdaq, and European stocks from 13 countries, 2000 to 2026, active and delisted. About 10,000 stocks in each region.
- Wealth measure: Bessembinder’s Expression (3). Each month a stock creates or destroys wealth equal to its start-of-month market cap times its excess return over T-bills, compounded forward to the end of the sample at the T-bill rate.
- I lag market cap to the previous month-end, so I know the capital at risk before the stock earns its return.
- Risk-free rate: the one-month US T-bill from Kenneth French’s public data library, the source Bessembinder uses.
- Concentration: sort stocks from highest to lowest wealth created, then read the cumulative share of the net total.
Starting point
The stock returns and market caps come from LSEG. Because that data is licensed, the raw file stays off this page, and I show the code without running it here. I print only aggregated totals. The one input I can show in full is the risk-free rate, which Kenneth French publishes for anyone to download.
Step 1. The risk-free rate
Bessembinder measures wealth against Treasury bills, so I need a monthly bill rate. Kenneth French publishes it in the same file as the Fama-French factors, as a zipped CSV going back to 1926.
import pandas as pd, numpy as np
import io, zipfile, urllib.request

# Kenneth French's monthly one-month T-bill rate, the source Bessembinder uses.
url = "https://mba.tuck.dartmouth.edu/pages/faculty/ken.french/ftp/F-F_Research_Data_Factors_CSV.zip"
z   = zipfile.ZipFile(io.BytesIO(urllib.request.urlopen(url).read()))
raw = z.read(z.namelist()[0]).decode("utf-8")           # the CSV text inside the zip

# ... parse the monthly block out of the messy header/footer ...

ff["RF"]   = ff["RF"] / 100                              # percent to decimal: 0.37 -> 0.0037
rf_monthly = ff[ff["date"] >= "2000-01-01"].set_index("date")["RF"]

print(f"Monthly T-bill rates: {len(rf_monthly)} months")
print(f"Period: {rf_monthly.index[0].date()} to {rf_monthly.index[-1].date()}")
print(f"Mean monthly Rf: {rf_monthly.mean()*100:.3f}% "
      f"(annualized: {rf_monthly.mean()*12*100:.2f}%)")
Monthly T-bill rates: 314 months
Period: 2000-01-01 to 2026-02-01
Mean monthly Rf: 0.156% (annualized: 1.87%)Cash paid 1.9% a year over the period. The formula compounds each month’s excess wealth forward to the end of the sample at this rate, so I precompute a forward factor for every month: the remaining T-bill growth from that month to February 2026.
cum_rf     = (1 + rf_monthly.sort_index()).cumprod()    # $1 in T-bills, compounded each month
fv_forward = cum_rf.iloc[-1] / cum_rf                    # remaining growth from month t to the end

print(f"Total T-bill compounding (2000-2026): {cum_rf.iloc[-1]:.3f}x")
Total T-bill compounding (2000-2026): 1.629xA dollar left in T-bills grew to 1.6 times its size over the 26 years. The running product behind this is a cumulative product, covered in Lesson 21 on the equity curve.
Step 2. Wealth created per stock
For each stock I walk its months in order and apply Bessembinder’s formula. Each month’s contribution is the lagged market cap times the excess return times the forward factor.
def compute_wealth(monthly, rf, fv):
    """Bessembinder Expression (3): wealth = SUM_t mcap[t-1] * (ret[t] - rf[t]) * FV[t,T]."""
    wealth, prev_mcap = 0.0, np.nan
    for ym, ret_m, mcap_end in monthly:                 # one stock's months, in order
        if not np.isnan(prev_mcap):                     # skip the first month: no lagged cap
            wealth += prev_mcap * (ret_m - rf[ym]) * fv[ym]   # the core formula
        if not np.isnan(mcap_end):
            prev_mcap = mcap_end                        # month-end cap is next month's capital
    return wealth
I run this over every stock in each region. I read the daily returns in chunks, compound them to monthly gross returns, and take the market cap at each month-end. I cap daily returns at plus or minus 50% to remove erroneous prints.
The US totals:
Stocks: 10,061
Beat T-bills: 5,611 (55.8%)
Trailed T-bills: 4,450 (44.2%)
Net wealth created: $66,366,944M
The European totals:
Stocks: 9,862
Beat T-bills: 4,629 (46.9%)
Trailed T-bills: 5,233 (53.1%)
Net wealth created: $25,785,255M
US stocks created $66.4 trillion of net wealth above T-bills over the period. European stocks created $25.8 trillion.
Step 3. Concentration
I sort stocks from highest to lowest wealth created and read the cumulative share of the net total held by the top few percent.
def concentration(wealth, pct_points):
    """Share of total net wealth created by the top X% of stocks."""
    s   = wealth.sort_values(ascending=False)           # biggest creators first
    net = s.sum()                                        # total net wealth
    return {p: s.iloc[:int(np.ceil(len(s) * p / 100))].sum() / net * 100
            for p in pct_points}

pct_points = [x / 2 for x in range(1, 9)]               # 0.5% to 4.0%
Top % US Europe
0.5% 60.7% 56.2%
1.0% 72.2% 71.8%
1.5% 79.4% 80.0%
2.0% 84.8% 85.7%
2.5% 88.6% 90.0%
3.0% 91.5% 93.4%
3.5% 94.0% 96.2%
4.0% 96.0% 98.5%The top 0.5% of US stocks created 60.7% of all the net wealth. The top 1.0% created 72.2%. By the top 4.0%, the share reaches 96.0%. Europe tracks the US at every step and runs slightly higher in the tail, reaching 98.5% at the top 4.0%.
The crossing point is where the cumulative share first hits 100%. I walk down the ranking until the running sum equals the net total, which gives it directly.
US: Top 541 stocks (5.4%) account for 100% of net wealth
Europe: Top 435 stocks (4.4%) account for 100% of net wealth
For the US that is the top 541 stocks, 5.4% of the 10,061 in the sample. For Europe it is the top 435 stocks, 4.4% of 9,862. So, the remaining 94.6% of US stocks and 95.6% of European stocks collectively matched Treasury bills over the 26 years.
Results
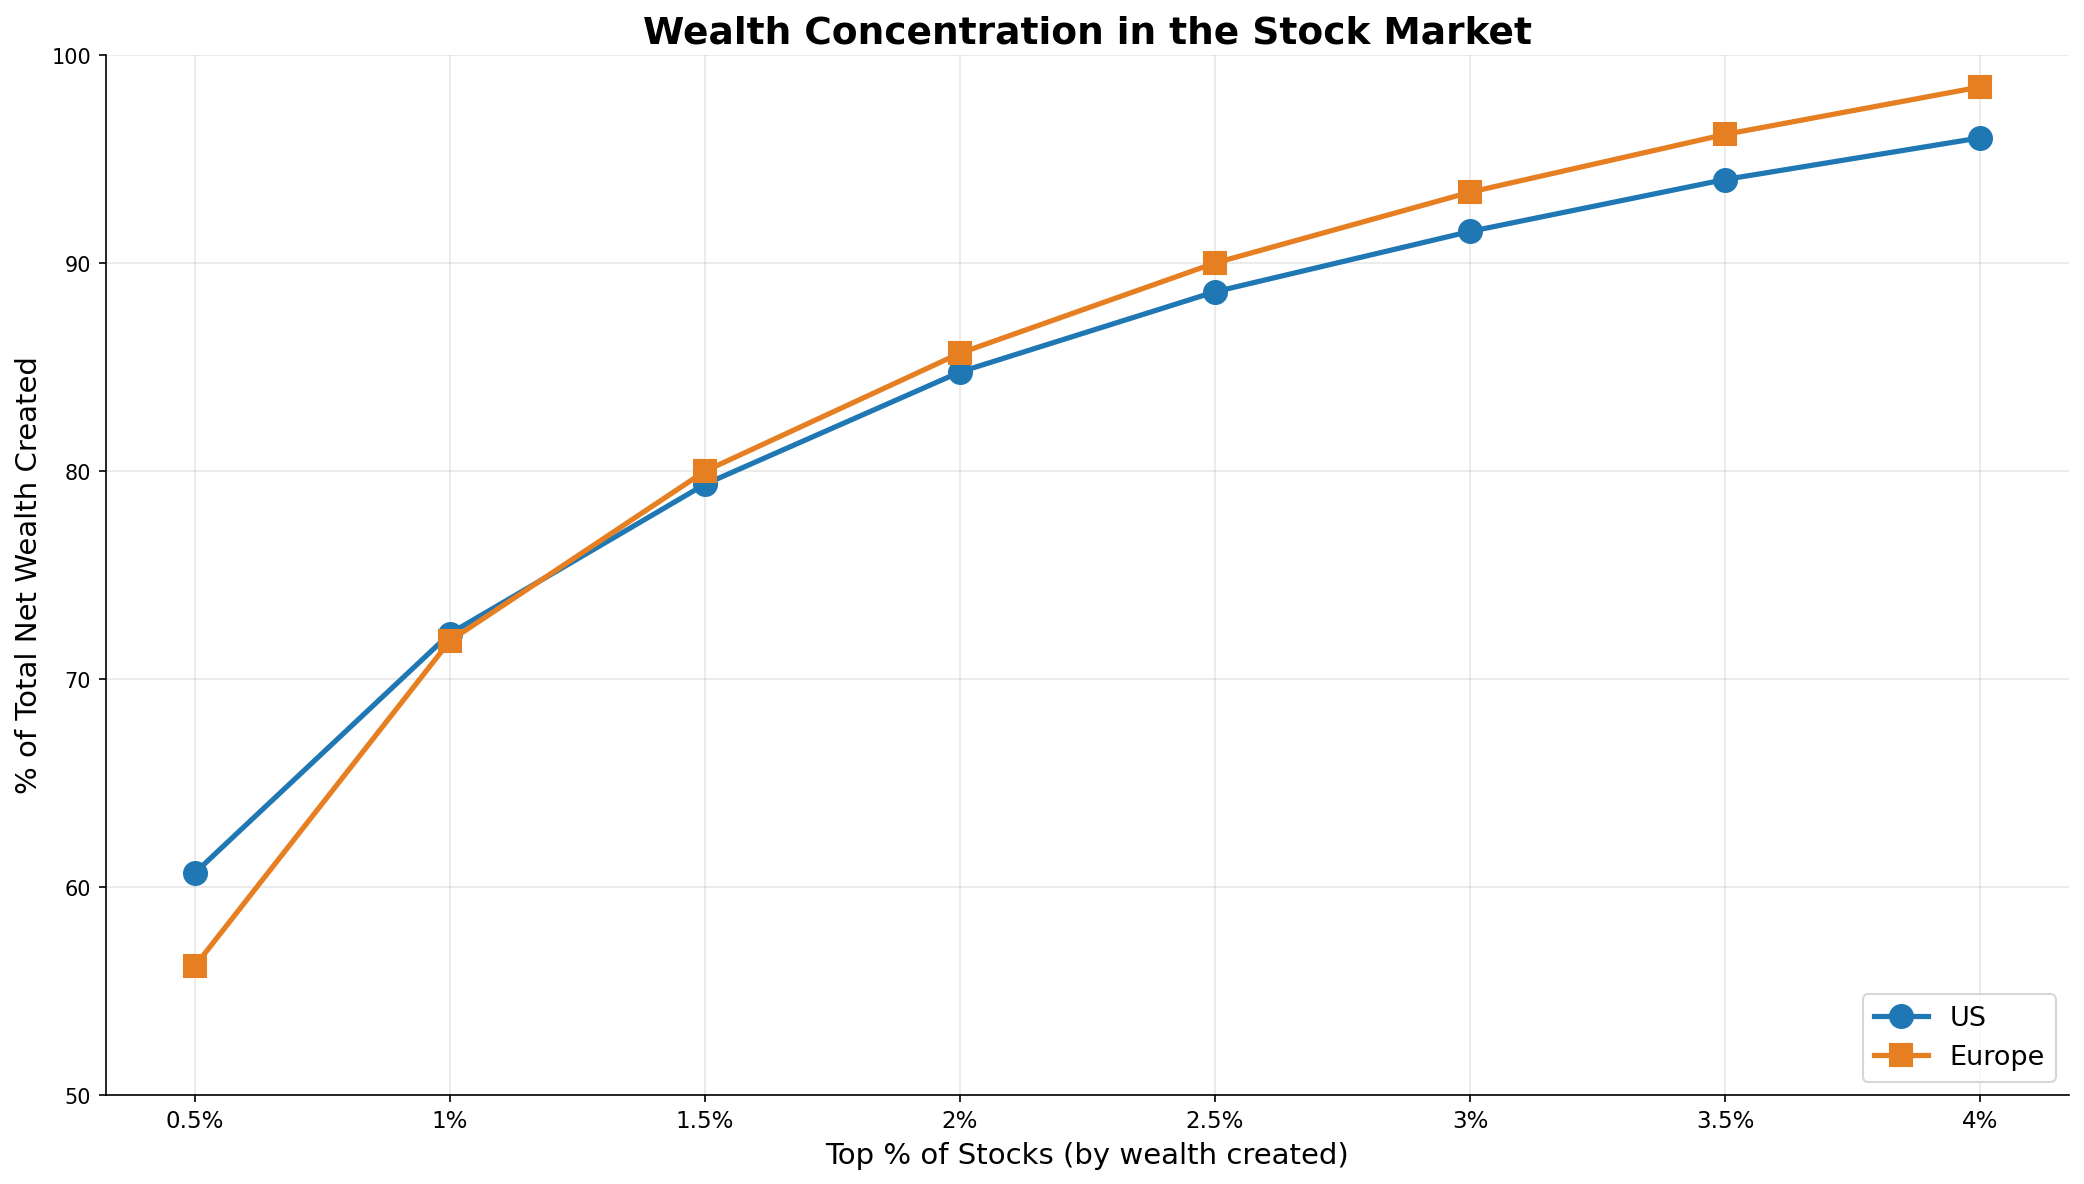
Both curves bend hard at the left and flatten quickly. An even distribution would trace a straight diagonal from the origin. The steeper the bend, the more the wealth sits in a handful of names. Europe bends slightly harder than the US at the top.
What this test does not settle
One period, and a tech-heavy one. The rise of a small set of US mega-caps dominates 2000 to 2026. The concentration I measure partly reflects that regime, so a different quarter-century could place the crossing point elsewhere.
Market cap stands in for invested capital. The formula weights each month by the previous month-end market cap, which treats the whole float as capital at risk. A large-cap stock moves the total even on a small excess return, so the ranking leans toward the biggest companies.
I fill gaps in the risk-free series. Months with no French rate fall back to 0.15% per month and months with no forward factor to 1.0. Few months need the fallback, so the effect on the totals is small.
I cap daily returns at plus or minus 50%. The cap removes bad prints. It also trims a handful of real extreme days, which slightly lowers the very top of the tail.
What it means
The pattern Bessembinder found in the US from 1926 to 2016 shows up again on 2000-to-2026 data, on both sides of the Atlantic. A few hundred stocks in each region account for all the net wealth created above Treasury bills, and the rest, as a group, earned the bill rate. Buffett compared investing to baseball with no called strikes: you can wait for the perfect pitch. But a portfolio that misses the top few percent holds names that together only matched Treasury bills, while owning the broad market guarantees you hold some of the winners. The takeaway is that a tiny minority of stocks creates all the market’s net wealth, so a portfolio that misses them earns close to cash.
Read next
- The longer you hold a stock, the less likely you are to beat the market The companion finding: how the odds of beating the index fall the longer you hold one name.
- The Magic Formula worked. Just not lately. One mechanical rule for tilting a portfolio toward the winners.
Disclaimer: this is a simplified, hypothetical accounting exercise for discussion purposes only. Not investment advice. Past performance does not predict future returns.
Data: US and European equity total returns and market caps from LSEG (licensed). The one-month T-bill rate is from Kenneth French’s public data library. Because the LSEG data is licensed, I do not reproduce the raw file here.