The longer you hold a stock, the less likely you are to beat the market
The longer you hold a single stock, the less likely you are to beat the market. Buffett once wrote that his favourite holding period is forever, so it is worth asking whether holding longer raises the odds of beating the index. It does the opposite. Across every US stock from 2000 to 2026, 45.7 percent beat the S&P 500 over one year, and only 27.0 percent beat it over fifteen.
The reason is concentration. A small number of big winners drive most of the market’s long-run return, and a cap-weighted index puts more and more weight on them as they grow. Pick one stock at random and hold it, and the longer you hold, the more likely the index has pulled ahead on the back of those few names.
The test
- Universe. All US common stocks on NYSE and Nasdaq, active and delisted, 2000 to 2026.
- Entry. Every month-end is an entry date.
- Horizons. 1, 3, 5, 7, 9, 11, 13, and 15 years. For each entry I measure the stock’s total return over exactly that horizon.
- Benchmark. The S&P 500 total return over the identical window.
- Beat. The stock’s forward return exceeds the S&P 500’s over the same dates.
- Delisted stocks. Kept in the sample. At delisting I take the last price and compound it at the Treasury-bill rate to the end of the horizon, following Bessembinder (2018).
Starting point
The test runs off one file of daily total returns for every US stock. Building it is a separate job that depends on the data vendor. I pull from LSEG Workspace. Because the data is licensed, the raw file stays off this page, and I show the code without running it here. The benchmark is the S&P 500 total return over each window.
Step 1. A cumulative return index per stock
To measure the return between any two dates, I first build a cumulative total-return index for each stock, starting at 1.0 on its first trading day. The forward return over any window is then the ratio of the index at the two ends.
# ret is each stock's daily total return. Build a cumulative index per stock,
# starting at 1.0 on its first trading day.
df["gross"]   = 1 + df["ret"]
df["cum_ret"] = df.groupby("Instrument")["gross"].cumprod()

# A wide table: rows are dates, columns are stocks, values the cumulative index.
cum = df.pivot_table(index="Date", columns="Instrument", values="cum_ret")

# Each stock's last trading day and last index level, for the delisting fill below.
last_trade = df.groupby("Instrument")["Date"].max()
last_level = df.groupby("Instrument")["cum_ret"].last()
The forward return from entry to exit is cum_ret at exit divided by cum_ret at entry, so one index per stock prices every horizon at once.
Step 2. Keep the delisted stocks, honestly
Dropping the stocks that delisted would bias the answer, because the names that disappear are mostly failures, and cutting them would flatter the long-horizon beat rate. So, I keep them. When a stock stops trading before the exit date, I take its last observed index level and compound it at the Treasury-bill rate to the exit, following Bessembinder (2018). A bankrupt stock therefore books its loss and then earns cash-like returns, while the index keeps compounding.
RF_ANNUAL = 0.03                                     # a flat T-bill proxy for delisted proceeds

def forward_return(alive, entry, exit):
    """Each stock's total return from entry to exit, keeping delisted names."""
    at_exit = cum.loc[exit].reindex(alive.index)     # index level at exit, if still trading
    gone    = at_exit.isna()                         # stopped trading before the exit date

    # Delisted: last level, then compound at T-bills for the months to the exit (Bessembinder).
    gap = (exit - last_trade[alive.index][gone]).dt.days / 365.25
    at_exit[gone] = last_level[alive.index][gone] * (1 + RF_ANNUAL) ** gap

    return at_exit / alive                           # forward total return over the window
This is what stops survivorship bias from inflating the long-horizon numbers. A failed stock is not quietly removed. It sits in the sample earning bills for the years after it dies, well behind the index.
Step 3. Did the stock beat the market over the exact window?
For each month-end entry and each horizon, I find the exit date exactly that many years later, take the stock’s forward return and the S&P 500’s over the same two dates, and record which won. Then I pool every stock-entry observation and take the share that beat the index.
HORIZONS   = [1, 3, 5, 7, 9, 11, 13, 15]             # holding horizons, in years
month_ends = cum.index.to_series().resample("ME").last()   # one entry date per month

def beat_rate(H):
    """Share of stock-entry observations that beat the S&P 500 over an exact H-year hold."""
    hits, total = 0, 0
    for entry in month_ends:
        exit  = cum.index.asof(entry + pd.DateOffset(years=H))   # the H-year exit date
        alive = cum.loc[entry].dropna()                          # stocks trading at entry
        fwd   = forward_return(alive, entry, exit)               # stock return over the window
        bench = spx.asof(exit) / spx.asof(entry)                 # S&P 500 over the same window
        hits  += (fwd > bench).sum()                             # stocks that beat the index
        total += fwd.notna().sum()
    return hits / total * 100
Here spx is the S&P 500 total-return index, priced over the identical dates so the comparison is like for like. Monthly entry dates give many overlapping windows, so each horizon rests on a large number of observations.
Results
 Horizon    % of stocks that beat the S&P 500
  1 year                  45.7%
  3 years                 42.4%
  5 years                 41.1%
  7 years                 38.5%
  9 years                 35.0%
 11 years                 31.6%
 13 years                 28.8%
 15 years                 27.0%
At one year, 45.7 percent of stocks beat the market, close to a coin flip. The share falls at every step: 41.1 percent at five years, 35.0 percent at nine, and 27.0 percent at fifteen. So, the longer the holding period, the smaller the chance a single stock stays ahead of the index.
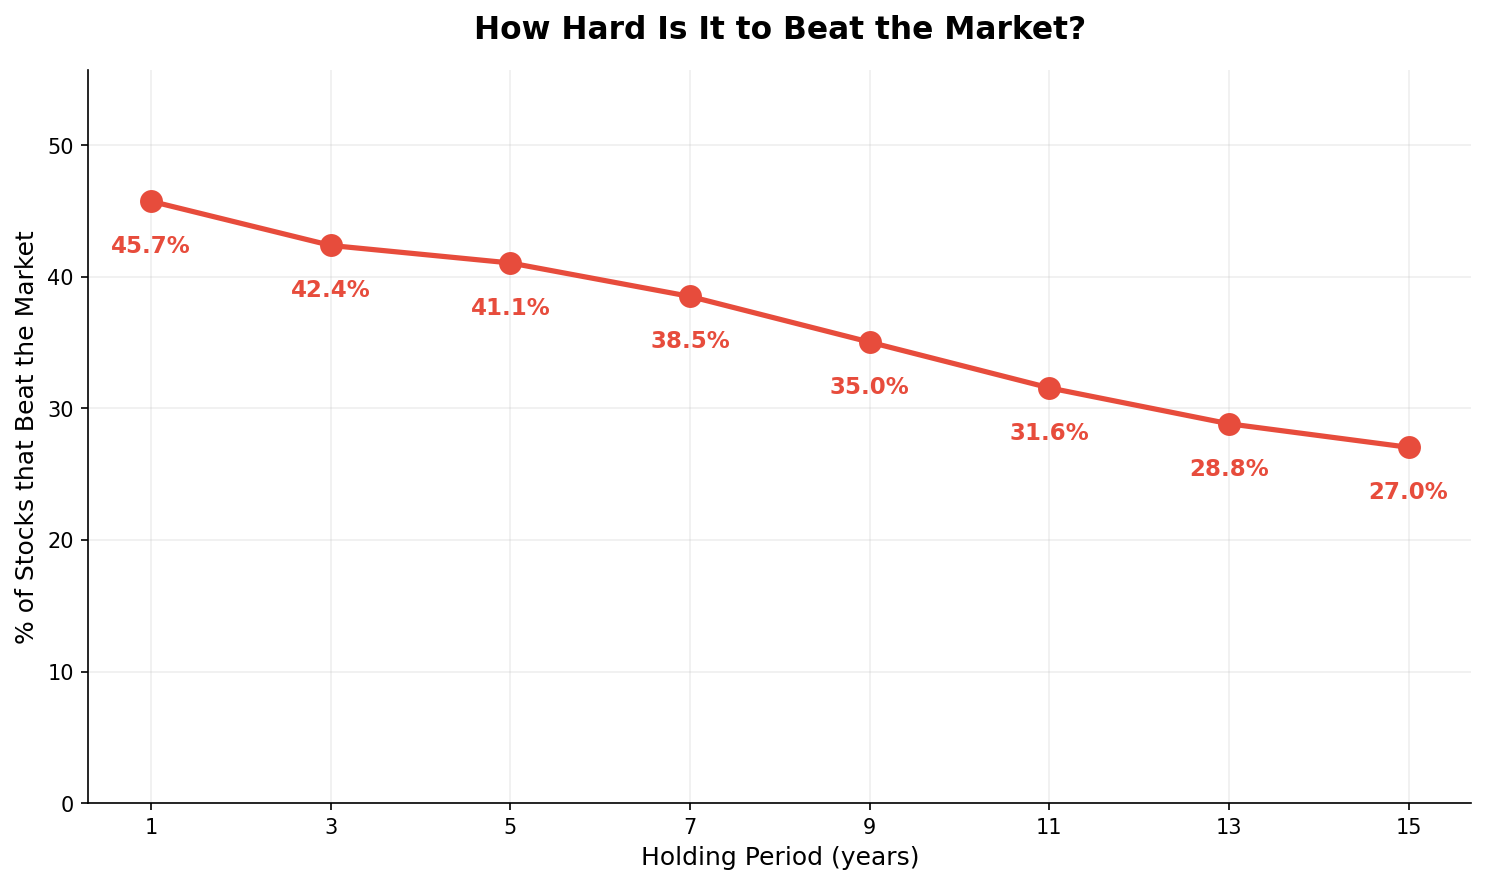
The line falls from 45.7 percent at one year to 27.0 percent at fifteen, and at no horizon does a majority of stocks beat the market. The cause is the concentration in the opening: a few big winners carry the market’s long-run return, and a cap-weighted index leans more and more on them as they grow. The median stock cannot match that compounding, so over long horizons most stocks fall behind the index even when the index itself does well. The same handful of winners is the subject of a companion post on how few stocks create the market’s wealth.
What this test does not settle
Overlapping windows. Monthly entry dates make adjacent observations share almost all of their holding period, so they are not independent draws, and I do not attach a confidence interval to any figure.
A constant risk-free proxy. I compound delisted proceeds at a flat 3 percent a year. The real Treasury-bill rate moved over the period, but a time-varying rate would not change the shape of the line.
The last price at delisting. I assume a delisted stock pays out its last traded price and then earns bills. Some bankruptcies pay less and some acquisitions pay a premium above the last print, so the delisting leg is an approximation.
The beat rate is not the whole story. This counts how often a single stock beats the index. It does not say by how much. The winners that do beat it can win by a lot, which is exactly why a diversified index does well even though most of its members trail it.
What it means
Holding a single stock for longer lowered the odds it beat the market. At one year nearly half of US stocks beat the S&P 500, and by fifteen years only about one in four did. The cause is concentration: a few big winners carry the index, and a cap-weighted benchmark leans ever more on them, so the typical stock falls further behind the longer the clock runs. This does not contradict Buffett’s favourite holding period of forever. He was describing great businesses chosen with care, and holding one picked at random is a different bet. The takeaway is that time is not on the side of a single stock, because without selection the longer you hold, the more likely the index’s winners have left it behind.
Read next
- Just 4% of stocks created nearly all the wealth The same few winners, measured as their share of all the wealth the market created.
- Avoiding bad companies matters as much as finding great ones If most single stocks trail the index, which ones to avoid.
Disclaimer: a simplified, descriptive historical study for discussion purposes only. Not investment advice. Past performance does not predict future returns.
Data: US equity daily total returns from LSEG Workspace (licensed); the benchmark is the S&P 500 total return. I do not reproduce the raw file here.