The most profitable US companies beat the S&P 500, and the least profitable lost money
Buffett wrote that it is far better to buy a wonderful company at a fair price than a fair company at a wonderful price, so I tested a simple version of that idea. From 2000 to 2026, a portfolio, or book, of the 30 highest-quality US companies returned 9.7% a year after trading costs. The S&P 500 returned 8.1% a year. A book of the 30 lowest-quality companies returned -0.4% a year and fell 91.3% at its worst.
Novy-Marx (2013) finds that firms with high gross profits relative to their assets earn higher average returns than firms with low ones. I test whether ranking US companies on profitability separates the best from the worst, by building one long-only book of the highest-quality names and one of the lowest, and running both from 2000 to 2026 against the S&P 500. I rank on three other profitability measures, listed below.
The strategy
- Universe: US common stocks, 2000 to 2026, with a market cap (share price times number of shares) above $500m.
- Signal: quality is the average percentile rank (the share of stocks that score lower) across three profitability measures. The measures are return on capital (operating profit relative to the capital the business employs), operating margin (earnings before interest and taxes, EBIT, divided by sales) and operating earnings over assets. I call the composite
profitability_core. It is point-in-time, using the prior month-end. - Portfolio: the top 30 names form the Great book and the bottom 30 form the Bad book. Both are equal weight, reset each month.
- Costs: the bid-ask half-spread (half the gap between the price to buy and the price to sell) on each traded name plus a 0.05% commission, charged on the rebalance day.
- Benchmark: the S&P 500, measured by the SPY exchange-traded fund with dividends reinvested.
I rank each measure across the stocks each month and average the three ranks, because a percentile rank limits how much one extreme margin contributes to the score. A name near the top scores high on all three at once, and a name near the bottom ranks low on all three.
Starting point
The backtest uses two files that I download from LSEG Workspace in a separate job, one of daily prices, quotes and market caps and one of company accounts. Because the data is licensed, the raw files stay off this page, and the code below is shown without being run on this page. The download route is the one from an earlier post, with the universe set to US common stocks and the profitability fields added.
Step 1. The quality score
Each month I take the three profitability measures, keep the names above the market-cap floor, and average their percentile ranks across the stocks.
# wide_roc, EBIT, REV, TA and MC are all wide tables from the data step: one row
# per month, one column per ticker, so they line up on the same months and names. The
# fundamentals are point-in-time, taken from the prior month-end.
ebit_margin = EBIT / REV                       # operating earnings over revenue
ebit_over_assets = EBIT / TA                   # operating earnings over assets

measures = {
    "ROC":        wide_roc,                    # return on total long-term capital
    "EBITmargin": ebit_margin,
    "EBITassets": ebit_over_assets,
}
METRICS = ["ROC", "EBITmargin", "EBITassets"]  # the profitability_core composite

# A name below the $500m floor becomes missing, so it leaves the ranking altogether
# instead of taking up a place in it.
above_floor = MC >= MIN_MARKET_CAP_M

ranked_measures = []
for measure_name in METRICS:
    measure = measures[measure_name].where(above_floor)
    # axis=1 ranks across the tickers inside one month, and pct=True reports that rank as
    # a share between 0 and 1, which puts the three measures on one scale.
    ranked_measures.append(measure.rank(axis=1, pct=True))

# Adding tables lines them up on month and ticker, so this is the average of the three
# percentile ranks, cell by cell.
profitability_core = sum(ranked_measures) / len(METRICS)
The rank is a percentile, so a name with a score near 1.0 is one of the most profitable in the month and a name with a score near 0.0 is one of the least profitable. I lag return on capital three months, because the figure is not known on the day the accounting period closes. That lag is not in the code shown.
Step 2. The two books
Each month I take the prior month-end signal, pick the top 30 for the Great book or the bottom 30 for the Bad book, and hold them equal weight. Weights then change with each name’s daily return until the next rebalance.
TOP_N = 30              # names in each book
COMMISSION = 0.0005     # 0.05% of the amount traded, charged on top of the half-spread


def run_book(pick):
    """pick='great' holds the top 30 by quality, 'bad' the bottom 30.
    Equal weight on the first trading day of each month; weights then
    change with each name's daily return until the next rebalance."""
    previous_weights = {}       # last month's weights, so this month's trade has a size
    monthly_paths = []          # one month of daily returns per rebalance

    for rebalance_month in months:
        # months holds one Period per rebalance month, and subtracting 1 from a Period
        # steps back one month. The book is therefore formed on a score that was already
        # known when the month opened.
        signal_month = rebalance_month - 1
        signal = profitability_core.loc[signal_month].dropna()

        if len(signal) < TOP_N:                         # wait until a full book exists
            continue

        if pick == "great":
            chosen = signal.nlargest(TOP_N)
        else:
            chosen = signal.nsmallest(TOP_N)
        selected_names = chosen.index

        target_weights = pd.Series(1.0 / TOP_N, index=selected_names)

        # A name held last month, this month, or both, can trade. The set union collects
        # each of those names once, and get(name, 0) reads a name missing from one side
        # as a zero weight, which is what entering or leaving the book means.
        traded_names = set(previous_weights) | set(selected_names)
        cost = 0.0
        for name in traded_names:
            weight_change = abs(target_weights.get(name, 0) - previous_weights.get(name, 0))
            cost += weight_change * (get_hs(name, rebalance_month) + COMMISSION)

        # book_return gives the daily path of this month, with the cost taken on day one
        month_path = book_return(selected_names, target_weights, rebalance_month, cost)
        monthly_paths.append(month_path)
        previous_weights = target_weights.to_dict()

    return pd.concat(monthly_paths)
Both books rebalance 310 times over the sample. The Great book replaces about 2.2 names a month and the Bad book about 4.7.
The run behind the numbers on this page differs from the code shown in three ways. It trades at the close of each month’s first trading day, so the new book earns returns from the second trading day. It sizes each trade from the weights just before the trade, after returns have moved them away from equal, so it also pays for bringing the names it keeps back to equal weight, which the code shown misses. And it leaves out a name whose latest filed accounts are more than 550 days old at the month-end, or that has no return on the rebalance day.
Step 3. Return and risk
I score each book on annualised return, volatility, the Sharpe ratio (with no risk-free rate, the return on cash, subtracted), and the worst drawdown, the largest fall from a previous peak.
TRADING_DAYS = 252      # trading days in a year, for turning daily figures into yearly


def performance_stats(daily_returns):
    """Annualised return, annualised volatility, Sharpe ratio and worst drawdown."""
    returns = daily_returns.dropna()
    number_of_days = len(returns)

    # cumprod multiplies the daily growth factors together, so nav is what one dollar
    # invested on the first day is worth on each later day.
    nav = (1 + returns).cumprod()

    # iloc[-1] is the last row, so nav.iloc[-1] is the total growth over the sample. The
    # sample is number_of_days / 252 years long, and raising growth to one over that
    # length turns it into a yearly rate.
    cagr = nav.iloc[-1] ** (TRADING_DAYS / number_of_days) - 1

    volatility = returns.std() * np.sqrt(TRADING_DAYS)

    # Sharpe ratio with no risk-free rate. The daily ratio is scaled by the square root of
    # 252 because a mean grows with the number of days while a standard deviation grows
    # with the square root of it.
    sharpe = returns.mean() / returns.std() * np.sqrt(TRADING_DAYS)

    # cummax is the highest value reached so far, so this is how far below the previous
    # peak the book is on each day. The minimum is the deepest of those falls.
    drawdown = nav / nav.cummax() - 1
    worst_drawdown = drawdown.min()

    return cagr, volatility, sharpe, worst_drawdown
CAGR Vol Sharpe Worst drawdown
Great +9.7% 21.6% 0.54 -50.0%
S&P 500 +8.1% 19.2% 0.50 -55.2%
Bad -0.4% 38.8% 0.18 -91.3%The Bad book lost 0.4% a year, so a dollar in it shrank over the 26 years. It was also more volatile, with 38.8% annual volatility against 21.6% for the Great book, and its worst drawdown was 91.3% against 50.0%. Lesson 33 covers the annualised return, the volatility and the Sharpe ratio in this table.
Step 4. Robustness check: downside risk
As a robustness check, I ask whether the comparison changes when only losses count. The Sharpe ratio divides return by total volatility, so upside and downside moves count the same. The Sortino ratio divides return by downside deviation alone, and the Calmar ratio divides return by the worst drawdown.
def downside_stats(daily_returns):
    """Sortino ratio and Calmar ratio. Each divides the return by a measure of loss."""
    returns = daily_returns.dropna()

    # np.minimum keeps every negative day and turns every positive day into a zero, so
    # squaring and averaging measures the losing days alone. The bar for a loss is zero
    # rather than the average return, which is what a minimum acceptable return of 0 means.
    losses_only = np.minimum(returns, 0.0)
    downside_deviation = np.sqrt((losses_only ** 2).mean())

    # The same worst drawdown and annualised return as in Step 3. Calmar needs both.
    nav = (1 + returns).cumprod()
    worst_drawdown = (nav / nav.cummax() - 1).min()
    cagr = nav.iloc[-1] ** (TRADING_DAYS / len(returns)) - 1

    # Sortino is the Sharpe ratio with downside deviation in place of volatility, and
    # Calmar divides the annualised return by the depth of the worst drawdown.
    sortino = returns.mean() / downside_deviation * np.sqrt(TRADING_DAYS)
    calmar = cagr / abs(worst_drawdown)

    return sortino, calmar
The table below also reports the annualised downside deviation, which is the denominator of the Sortino ratio.
           Sortino   Calmar   Down deviation
Great         0.77     0.19            15.1%
S&P 500       0.71     0.15            13.6%
Bad           0.26     0.00            27.4%
For every book the downside deviation is about 70% of the volatility, so each Sortino ratio is about 1.4 times the Sharpe ratio, and a gap between two books is larger on Sortino for that reason alone. The Great book’s Sortino ratio is about three times the Bad book’s (0.77 against 0.26), and so is its Sharpe ratio (0.54 against 0.18). So, counting only losing days does not change the comparison. On Calmar the Bad book is about zero, because its return over the sample is negative and its worst drawdown is 91.3%. Lesson 32 covers drawdown itself.
Results
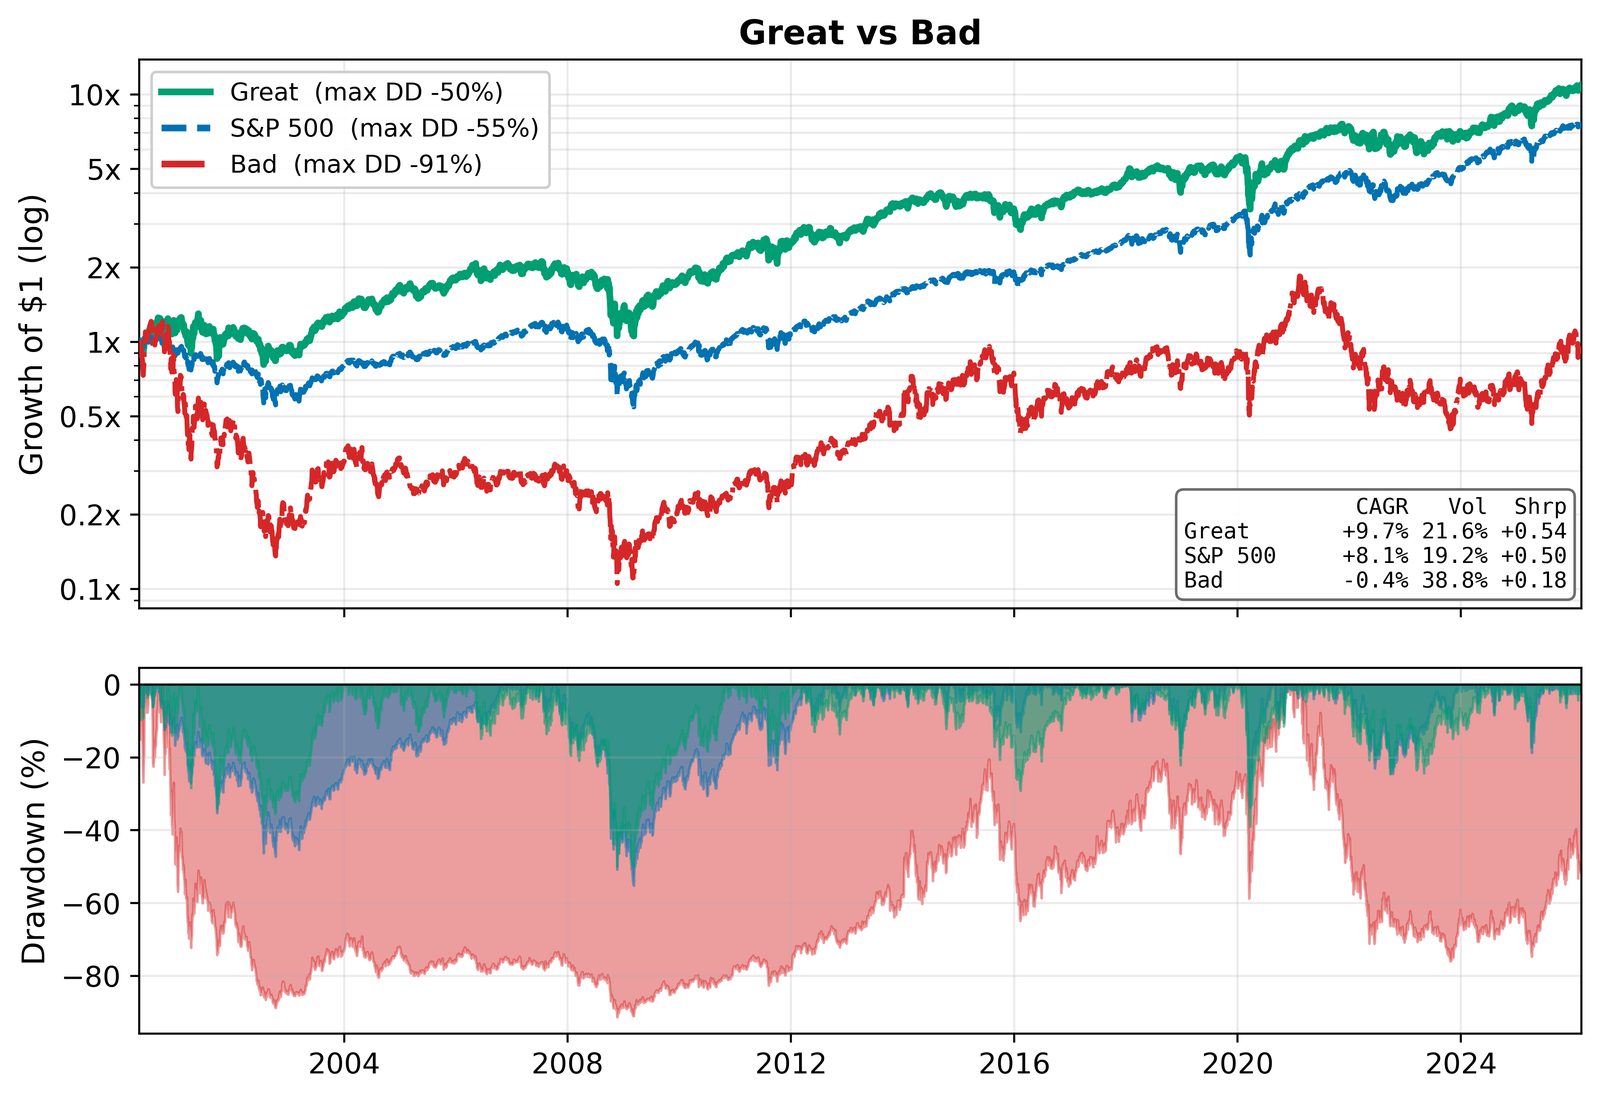
The top panel shows a dollar in each book on a log scale, where the vertical distance between two lines measures the ratio of their values: green for the Great book, blue dashed for the S&P 500 and red for the Bad book. The Great book ends above the S&P 500, but the distance between the two lines, the Great book’s lead, increases until about 2012 and decreases from 2012 to 2026. So the lead comes from 2000 to 2012, and from 2012 to 2026 the S&P 500 returned more. The Bad book falls in the 2000 to 2002 bust and again in 2008, regains its 2000 peak late in 2020, and then falls again. The bottom panel shows each book’s distance below its previous peak: the Bad book is below its peak for most of the sample, with a trough of 91.3%.
Trading costs took 0.4% a year off the Great book and 1.0% a year off the Bad book. The Bad book pays more because it trades twice as much, at about 242% one-way turnover a year, the value bought as a share of the book, against 122% for the Great book, and its unprofitable small-cap names have wider spreads. Costs turned the Bad book’s gross return of 0.6% a year into a net loss of 0.4%.
Limitations
One specification. I ran a single version of the quality score, three profitability measures with equal-weighted top and bottom 30 names rebalanced monthly, and did not test other thresholds or portfolio sizes. Buffett’s wonderful company also includes valuation, management and future prospects, so this test covers only the profitability part of the idea. The backtest is one sample, and I do not calculate a confidence interval, a range that likely contains the true value.
The Bad book is not a short strategy. The bottom 30 are unprofitable small companies with wide spreads, and their shares may be hard or costly to borrow for a short sale, which sells borrowed shares to profit from a fall. This test charges no borrowing fee and does not check whether the shares could be borrowed, so it does not show that shorting the Bad book would have made money. The Bad book describes the returns of the lowest-quality names.
Long-only, two separate books. I show the great and the bad as two long books. A long-short quality portfolio that buys one and shorts the other is a different test, with financing costs and borrow constraints this backtest does not include.
Costs are approximate. The half-spread plus a flat commission leave out market impact, the move in price that a trade itself causes, which tends to be larger for small names with wide spreads, such as those in the Bad book. Where a name has no valid quote on the rebalance day, the run charges a default half-spread of 0.25%, and it caps each half-spread at 5%. The true cost for the Bad book may be higher than the 1.0% a year charged here.
Return on capital is a proxy. I use the closest field the vendor reports for return on capital, and I do not show here how a hand-built version would change the two books.
Conclusion
Over 26 years, ranking US companies on three profitability measures gave a highest-quality book that beat the S&P 500 by 1.6 percentage points a year after costs, and a lowest-quality book that lost money and fell 91.3% at its worst. The Great book’s lead comes from 2000 to 2012, and from 2012 to 2026 the S&P 500 returned more than the Great book. I compared each book with the S&P 500 and did not test a portfolio that leaves out only the least profitable names, so this test does not measure how much avoiding them adds to a portfolio. The takeaway is that, in this sample, the most profitable companies as a group beat the index and the least profitable lost money.
Read next
- The Magic Formula worked. Just not lately. The same quality-and-value idea, built as a mechanical stock screen.
- About 5% of stocks created all the net wealth Why owning the winners, and avoiding the worst, decides a portfolio.
Disclaimer: simplified, hypothetical backtest with approximate trading costs, for discussion purposes only. Not investment advice. Past performance does not guarantee future returns.
Sources: Novy-Marx (2013), “The Other Side of Value: The Gross Profitability Premium”, Journal of Financial Economics. Data: US equity prices, fundamentals, and bid-ask quotes from LSEG Workspace (licensed). The benchmark is the SPY fund’s price adjusted for dividends, from Yahoo Finance. I do not reproduce the raw file here.