Buy the dip? US vs. Europe
Buying a US stock after a 5% fall from its own peak beat its market by 6.8% over the next 12 months. The same rule in Europe beat its market by only 1.3%, turned negative from a 10% fall on, and trailed by 23.1% after a 75% fall.
I test whether buying the dip pays across markets. This extends an earlier post on buying US dips. That one bought after a fixed drop and looked only at the US. Here I use each stock’s drawdown from its own running peak, hold for 12 months, and run the same test on the US against a combined Europe of 13 countries.
The measure is the buy-and-hold abnormal return (BHAR). It is the stock’s compounded total return, the price change plus reinvested dividends, over the 12 months after the trigger, less the compounded return of its own market over those same days, less the round-trip trading cost. A positive BHAR means that buying the dip beat the market net of costs.
The strategy
- Universe. 10,061 US common stocks, and 9,971 stocks across 13 European markets: GB, SE, FI, DK, NO, DE, FR, IT, NL, ES, BE, PT, and AT. Both include active and delisted stocks, through early 2026.
- Event. At each month-end, a stock’s drawdown from its own running peak crosses a threshold. I take one event per drawdown episode, the month it first crosses, and reset when the stock makes a new peak.
- Threshold. I run every threshold from 5% to 75% in 5-point steps.
- Hold. 252 trading days, about 12 months, buy and hold.
- Benchmark. Each stock against its own country’s value-weighted market. I pool European stocks only after measuring each against its home market.
- Costs. The bid-ask half-spread (half the gap between the price to buy and the price to sell) on entry and on exit, plus a 0.05% commission each way.
Starting point
The backtest runs off one price file per market. Building each file is a separate job that depends on the data vendor. I pull from LSEG Workspace. Because the data is licensed, the raw files stay off this page, and I show the code without running it here. I convert market caps, each company’s share price times its number of shares, to US dollars for comparison, GB through GBPUSD and the rest through EURUSD, using daily rates from the same source.
Step 1. Drawdown and events
Each stock has a running peak. The drawdown is how far below that peak it currently is.
HORIZON_DAYS = 252      # hold for about 12 trading months
COMMISSION = 0.0005     # 0.05% each way

# prices is one market's daily table, one row per stock-day. Compounding the daily returns
# gives the level a stock has reached, and cummax gives the highest level so far.
# cumprod and cummax both run down the rows in the order they appear in the table, so the
# rows have to be in date order within each stock. Grouping by Instrument stops one
# stock's running peak from continuing into the next stock.
prices["ret_mult"] = 1 + prices["ret"]
prices["cum_ret"] = prices.groupby("Instrument")["ret_mult"].cumprod()
prices["cum_max"] = prices.groupby("Instrument")["cum_ret"].cummax()
prices["drawdown"] = prices["cum_ret"] / prices["cum_max"] - 1.0
I check the drawdown only at month-ends, so a stock triggers at most once a month. One drawdown episode gives one event, the first month it crosses the threshold. The episode closes when the stock reclaims a new peak, and only then can it trigger again.
Each stock arrives here as a small dictionary of arrays: one entry per field, and each array holds one value per trading day, in date order.
def find_events(stock, threshold):
    """One event per drawdown episode: the month its drawdown first crosses -threshold."""
    dates = stock["dates"]
    drawdowns = stock["dds"]                # "dds" holds the drawdown on each of those dates
    month_ends = stock["month_ends"]

    events = []
    in_episode = False

    # Walk the stock's history one day at a time. The loop keeps the episode state, so a
    # stock that stays below the threshold for a year still produces one event rather than
    # twelve, and only a new peak lets it produce another.
    for day in range(len(dates)):
        if dates[day] not in month_ends:
            continue                        # the rule only reads month-end closes

        drawdown = drawdowns[day]
        if drawdown <= -threshold:
            if not in_episode:              # the first crossing of this episode
                in_episode = True
                buy_day = day + 1
                # Buy at the close after the signal, so the test cannot trade on a price it had not yet seen.
                if buy_day < len(dates):    # a stock whose history ends here buys nothing
                    events.append(buy_day)
        elif drawdown >= 0:
            in_episode = False              # back to a new peak: the episode resets

    return events
I read the event at the month-end close and buy at the following close, so the signal lags by one day and the test does not buy on information it could not have had. The reason to lag is in Lesson 30. I also drop any event whose 12-month window would run past the end of the sample, unless the stock delisted first, so the deep thresholds do not fill with holds cut short by the data ending.
Step 2. The abnormal return, net of costs
For each event I compound the stock over the next 252 days, compound its own market over the same days, and subtract. Then I take off the half-spread and commission to enter and to exit.
def bhar(stock, market_returns, buy_index):
    """12-month buy-and-hold abnormal return for one event, net of costs."""
    daily_returns = stock["ret"]
    dates = stock["dates"]
    half_spreads = stock["half_spread"]

    # The hold is 252 trading days, but a stock that delists first runs out of rows, and
    # then the position is held only for as long as the stock kept trading.
    last_index = min(buy_index + HORIZON_DAYS, len(daily_returns))

    # np.prod multiplies every element of an array together, which compounds the daily
    # returns of the days held into one total return.
    held_returns = daily_returns[buy_index:last_index]
    stock_return = np.prod(1 + held_returns) - 1

    # market_returns is a dictionary keyed by date, so it is read one day at a time. A day
    # the market has no entry for contributes a zero return, the default handed to get, so
    # a missing benchmark day leaves the market flat for that day, so the stock's move that day counts as abnormal return.
    market_growth = 1.0
    for date in dates[buy_index:last_index]:
        market_growth *= 1 + market_returns.get(date, 0.0)
    market_return = market_growth - 1

    # Pay the half-spread and the commission on the way in, and again on the way out.
    entry_cost = half_spreads[buy_index] + COMMISSION
    exit_cost = half_spreads[last_index - 1] + COMMISSION   # the last day the stock was held
    return stock_return - market_return - entry_cost - exit_cost
I value-weight the market return by the previous day’s market cap, so large stocks have most of the weight in the benchmark. Where a European quote was missing or the bid and ask were swapped, I fill the half-spread with the median, the middle value, for that country and year, which keeps the cost estimate on the right scale for each market.
Step 3. Across every threshold and both markets
For each threshold I find the events, price each one, and take the median. US stocks go against the US market. European stocks go against their own country’s market first, and then I pool the abnormal returns into one European figure.
thresholds = np.arange(0.05, 0.80, 0.05)          # 5% to 75% in 5-point steps

for threshold in thresholds:
    # US: every stock against the US market.
    us_bhars = []
    for stock in us_stocks.values():
        for buy_index in find_events(stock, threshold):
            us_bhars.append(bhar(stock, us_market, buy_index))

    # Europe: eu_data is one entry per country, holding that country's value-weighted
    # market and its stocks. Each stock is measured against its OWN country's market, and
    # the results are pooled only afterwards, so no stock is scored against a foreign index.
    eu_bhars = []
    for country_data in eu_data.values():
        home_market = country_data["market_vw"]
        for stock in country_data["stock_data"].values():
            for buy_index in find_events(stock, threshold):
                eu_bhars.append(bhar(stock, home_market, buy_index))

    print(f"{int(threshold*100):>2d}%  "
          f"US {np.median(us_bhars) * 100:+.1f}%  ({len(us_bhars):>6,} events)  "
          f"EU {np.median(eu_bhars) * 100:+.1f}%  ({len(eu_bhars):>6,} events)")
5% US +6.8% (33,737 events) EU +1.3% (27,337 events)
10% US +6.8% (26,651 events) EU -2.1% (22,183 events)
15% US +5.7% (21,544 events) EU -6.6% (18,627 events)
20% US +3.8% (17,922 events) EU -11.2% (16,149 events)
25% US +2.5% (15,413 events) EU -14.6% (14,420 events)
30% US +0.5% (13,453 events) EU -16.4% (13,086 events)
35% US -0.1% (11,951 events) EU -18.6% (11,980 events)
40% US -0.6% (10,665 events) EU -19.7% (11,044 events)
45% US -1.5% ( 9,611 events) EU -20.3% (10,229 events)
50% US -2.4% ( 8,708 events) EU -20.4% ( 9,453 events)
55% US -2.6% ( 7,803 events) EU -21.2% ( 8,718 events)
60% US -2.4% ( 6,992 events) EU -21.8% ( 8,003 events)
65% US -1.7% ( 6,230 events) EU -21.8% ( 7,341 events)
70% US -2.4% ( 5,533 events) EU -21.2% ( 6,652 events)
75% US -1.4% ( 4,849 events) EU -23.1% ( 6,031 events)In the US the abnormal return is 6.8% after a 5% drawdown and 6.8% again after a 10% one. It decreases as the drawdown deepens, is 0.5% at a 30% drawdown, and turns negative around 35%. From there it stays negative, at most 2.6% below the market at a 55% drawdown, and 1.4% below at a 75% drawdown.
In Europe the median abnormal return is 1.3% after a 5% drawdown and negative from 10% on. It decreases at every step down to a 60% drawdown: 6.6% below the market at 15%, 11.2% below at 20%, 16.4% below at 30%, 20.4% below at 50%, and 21.8% below at 60%. From 55% on it stays between 21.2% and 23.1% below the market, ending 23.1% below after a 75% drawdown. So, in Europe a deeper drawdown tends to mean a worse 12 months.
Results
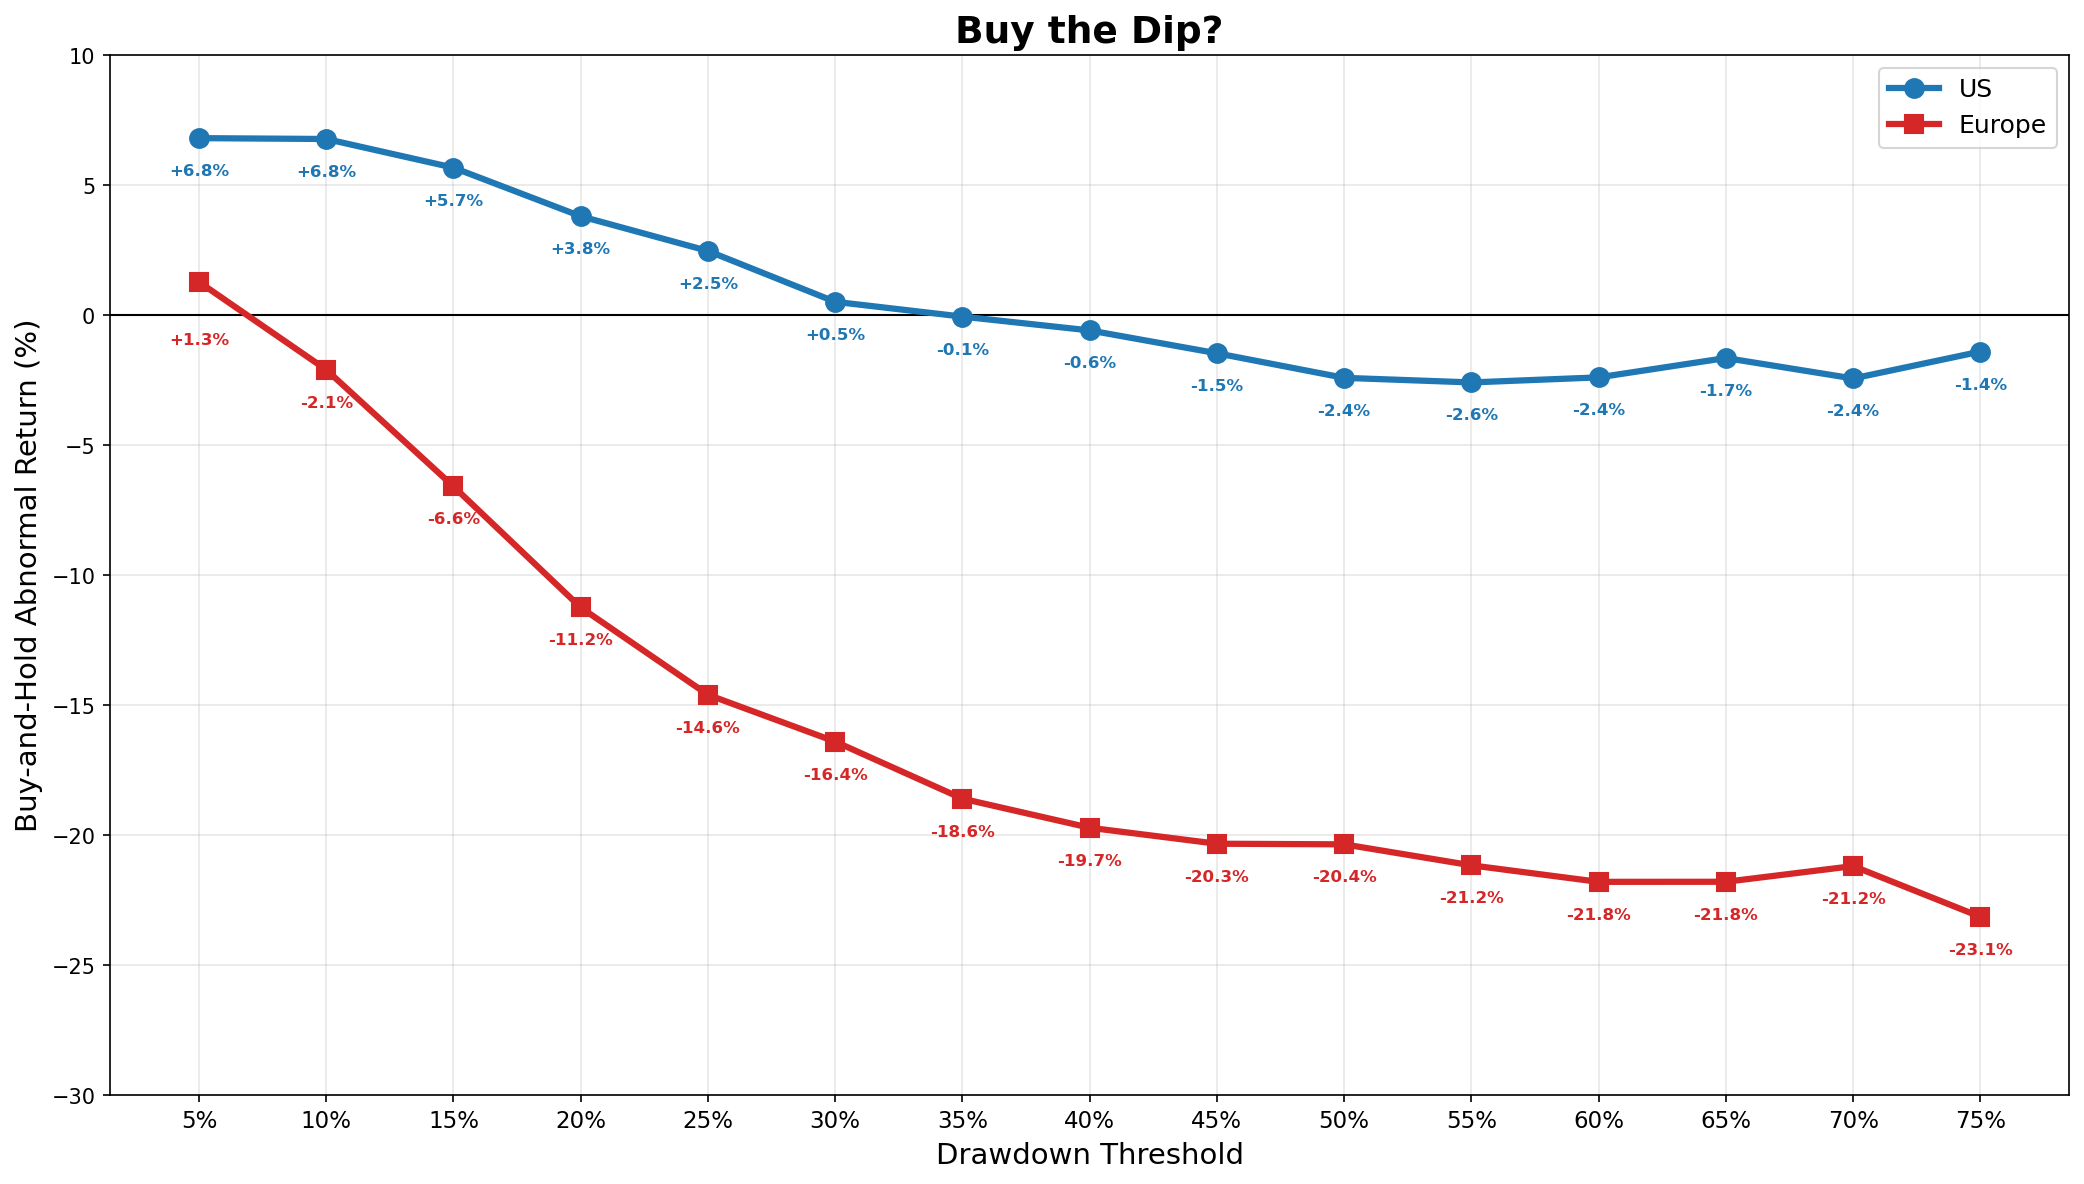
The European line is below the US line at every threshold, and the gap widens as the drawdown deepens. The US line stays near the market at every threshold, a few points above it for shallow drawdowns and a few points below it for deep ones.
The European stocks that trigger are smaller and cost more to trade, which is part of the difference. At a 5% drawdown the median US trigger was a 742 million dollar company with a 0.1% half-spread. The median European trigger was a 271 million dollar company with a 0.7% half-spread. At a 75% drawdown the US median was 185 million and the European 32 million, and the European half-spread was 1.3% against 0.3% for the US. So, buying the dip in Europe means holding smaller, more thinly traded stocks and paying more to enter and to exit.
Limitations
Each stock against its own market. The BHAR is relative to the stock’s own market, so a negative European figure means the dip stock underperformed that market, whether that market rose or fell. It does not measure the absolute return of buying the dip, and a market that itself fell hard would make the comparison look better than the absolute return was.
Costs are approximate. The half-spread plus a flat commission understates real trading costs, and slippage is worse in small, thinly traded stocks, which the deep thresholds select. I fill many European spreads with a country-year median where quotes were missing or swapped, so the European cost is an estimate and the true cost on deep European dips is probably higher than charged here.
The events are not independent. Drawdowns cluster in bear markets, so a single bad year like 2008 or 2020 fills many events at once. The events are therefore not as many separate experiments as their counts suggest, and I do not attach a confidence interval, a range that likely contains the true value, to any single figure.
It is a per-event median. Each number is the middle event at that threshold. Turning it into a portfolio return would need position sizing and would have to handle the overlap between events, which this test does not model.
Conclusion
Buying the dip behaved differently on the two continents. In the US the rule was within 6.8 points of the market at every threshold, ahead after shallow drawdowns and behind after deep ones. In Europe it underperformed the market from a 10% drawdown on, by more at every deeper threshold down to 60%, and by 23.1% after a 75% drawdown. The European dip stocks are smaller and dearer to trade, and their returns after a deep drawdown did not recover. The takeaway is that the rule was roughly flat in the US and, across Europe, cost more the deeper the drawdown, at least down to a 60% one.
Read next
- Does a large one-day move in the S&P 500 predict next week’s return? The earlier US dip test that prompted this comparison.
- Should you wait for new lows or new highs? What waiting for a signal costs a steady saver.
Disclaimer: simplified, hypothetical backtest with approximate trading costs, for discussion purposes only. Not investment advice. Past performance does not guarantee future returns.
Data: US and European equity total returns, bid-ask quotes, and market caps from LSEG Workspace (licensed), with EURUSD and GBPUSD from the same source for currency conversion. I benchmark each stock against its own country’s value-weighted market. I do not reproduce the raw file here.