Do large stocks crash more often after doubling?
Of the 500 largest US stocks, 28.3% of those that had gained at least 100% over the previous two years crashed within the next two years, meaning that they fell at least 40% from a peak. On the same dates, 22.0% of all large stocks crashed, and 27.7% of the large stocks with similar past volatility that had gained less than 100%. Greenwood, Shleifer and You (2019) find that US industries whose stock prices rose 100% over two years crashed more often in the next two years, and that the volatility of the rise is among the traits that help predict a crash.
I adapt their test from industries to single large US stocks. At each gain threshold, such as 100%, I compare the stocks whose gain was at least the threshold with all eligible large stocks on the same dates, and with the eligible large stocks whose gain was below the threshold and whose prices had swung about as much from day to day. The bigger the gain, the more often a crash followed, and at every gain the crash rate after the gain was within a few points of the rate of the large stocks with similar past volatility and smaller gains.
The test
- Universe. At each month-end, the 500 largest US stocks by market value, including stocks that later delisted. Known closed-end funds and preference shares are left out, and a company recorded under two instrument codes counts once. A stock counts only if its price was at least $1 at that month-end and 24 months earlier, and its market value at least $50 million.
- Gain. The total return over the previous 24 months, the price change plus reinvested dividends. At each threshold from 50% to 200% in steps of 25 points, a stock counts at the first month-end at which its gain was at least the threshold, and again at the first such month-end at least 24 months after its previous event.
- Crash. A fall of at least 40% from a preceding peak within the next 24 months, measured on month-end values, the threshold Greenwood, Shleifer and You (2019) use. A stock that delisted counts as cash at its last value.
- Comparisons. On the same month-ends, all large stocks, and the large stocks in the same tenth by past volatility whose gain was below the threshold, so that the stocks with the gain are compared with stocks without the gain. Volatility measures how much a price swings from day to day: here, the standard deviation of a stock’s daily returns, their typical distance from their average, averaged over the previous 24 months.
- Data checks. A daily move beyond ±50% counts only if the company’s market value moved at least half as much in the same direction. An event, or a stock-month in a comparison, is left out when a daily return within the two years before or after it is missing or unconfirmed, or when a month is missing inside the next 24 months.
- Sample. Month-ends from January 2002 to February 2024, each followed for two years, to February 2026.
Starting point
The test runs off two tables, built from daily LSEG Workspace data for about 10,000 US stocks, listed and delisted, from January 2000 to February 2026. The event table has one row per stock-month at which a gain was at least a threshold, and the outcome table has one row per stock-month that passes the filters. Each row carries the stock’s size group, its gain over the previous 24 months, its worst fall from a preceding peak over the next 24 months, its past volatility and the data flags. Building the tables is a separate job: compounding the daily returns into monthly ones, the data checks, the ranking and the events. The daily data comes from the download in Download stock data from LSEG Workspace in Python. Because the data is licensed, the raw files stay off this page, and I show the code without running it here.
Step 1. The comparison crash rates
For each large stock-month, I find its tenth by past volatility among the large stocks of the same month-end. Then, on each month-end, the crash rate of all large stocks is the share of them that crashed within the next 24 months. At each threshold, each tenth also has a crash rate, computed from its stocks whose gain was below the threshold.
import numpy as np
import pandas as pd

CRASH = 40            # a crash is a fall of at least 40% from a preceding peak

# One row per event: a stock-month at which the gain over the previous 24 months was at least a
# threshold, with the stock's size group, that gain (past) and its worst fall over the next 24
# months (worst), both in %.
events = pd.read_csv("event_table.csv")
# One row per stock-month that passes the filters, with the same columns and the past volatility.
outcomes = pd.read_csv("stock_month_outcomes.csv")
large = outcomes.loc[outcomes["size"] == "large"].copy()


def tenths(values):
    """The tenth of each value among all the values: 0 for the lowest tenth, 9 for the highest."""
    return pd.qcut(values, 10, labels=False, duplicates="drop")


# transform returns one value per row: here, each stock-month's tenth by past volatility among
# the large stocks of its own month-end.
large["tenth"] = large.groupby("month")["past_volatility"].transform(tenths)
large["crashed"] = 100.0 * (large["worst"] <= -CRASH)       # 100 if it crashed, 0 if not

# status is "gap" when a month is missing inside the next 24 months, and flagged is True when a
# daily return near the stock-month could not be confirmed. Both are left out of the comparison.
usable = large.loc[(large["status"] != "gap") & ~large["flagged"]]
all_rate = usable.groupby("month")["crashed"].mean().rename("all_rate").reset_index()

# At each threshold, the crash rate of each tenth on each month-end, from its usable stocks whose
# gain was below the threshold. assign adds the threshold as a column, and concat stacks the
# tables of all thresholds into one.
similar_rates = []
for threshold in sorted(events["threshold"].unique()):      # 50, 75, ..., 200
    below = usable.loc[usable["past"] < threshold]
    rate = below.groupby(["month", "tenth"])["crashed"].mean().rename("similar_rate").reset_index()
    similar_rates.append(rate.assign(threshold=threshold))
similar_rate = pd.concat(similar_rates)
Step 2. The crash rates after each gain
On its own month-end, each event is compared with the crash rate of all large stocks and with the crash rate of its tenth at its own threshold. Each comparison averages these rates over the events, so it has the events’ mix of dates.
is_large = events["size"] == "large"
kept = is_large & (events["status"] != "gap") & ~events["flagged"]
print(f"{kept.sum():,} of {is_large.sum():,} large-stock events kept; "
      f"{(is_large & ~kept).sum():,} left out for a missing month or an unconfirmed daily return")

large_events = events.loc[kept]
# Each merge adds columns from the other table on the rows that match: the event's tenth, then the
# crash rate of all large stocks on the event's month-end, then the crash rate of the event's
# tenth on that month-end at the event's threshold.
large_events = large_events.merge(large[["month", "Instrument", "tenth"]], on=["month", "Instrument"])
large_events = large_events.merge(all_rate, on="month")
large_events = large_events.merge(similar_rate, on=["threshold", "month", "tenth"])
large_events["crashed"] = 100.0 * (large_events["worst"] <= -CRASH)

by_threshold = large_events.groupby("threshold")
rates = pd.DataFrame({
    "events": by_threshold.size(),
    "after the gain": by_threshold["crashed"].mean(),
    "all large stocks": by_threshold["all_rate"].mean(),
    "similar volatility, smaller gain": by_threshold["similar_rate"].mean(),
})
rates["gap to all large stocks"] = rates["after the gain"] - rates["all large stocks"]
rates["gap to similar volatility, smaller gain"] = (rates["after the gain"]
                                                    - rates["similar volatility, smaller gain"])
print("Crashed within the next 24 months, % of each group on the events' month-ends; gaps in points")
print(rates.round(1).to_string())
10,030 of 10,046 large-stock events kept; 16 left out for a missing month or an unconfirmed daily return
Crashed within the next 24 months, % of each group on the events' month-ends; gaps in points
events after the gain all large stocks similar volatility, smaller gain gap to all large stocks gap to similar volatility, smaller gain
threshold
50 3239 21.6 21.3 22.5 0.3 -0.9
75 2271 23.7 21.8 25.2 2.0 -1.5
100 1568 28.3 22.0 27.7 6.4 0.6
125 1106 31.5 21.4 29.8 10.1 1.7
150 795 35.7 22.1 33.8 13.6 1.9
175 585 38.5 22.3 36.5 16.2 1.9
200 466 41.6 22.1 37.7 19.6 3.9Across the seven thresholds, 10,030 events remained after 16 exclusions. The same stock can contribute events at several thresholds, so this is not a count of distinct stocks. After a gain of at least 100%, 28.3% of the 1,568 events crashed. On the same month-ends, 22.0% of all large stocks crashed, and 27.7% of the large stocks in the same tenth by past volatility whose gain was below 100%. So, the stocks that had doubled crashed 6.4 percentage points more often than all large stocks, and 0.6 points more often than the large stocks with similar past volatility and smaller gains.
Step 3. The chart
import matplotlib.pyplot as plt
import matplotlib.ticker as mticker

# The site's chart colours: the cream background, the text, the light grid lines, the pale frame,
# the axis labels and the tick labels, then the three lines.
BG, INK, GRID, SPINE, AXIS_TEXT, TICK = "#FCEFE3", "#1f1f1f", "#EADCCC", "#D5C6B4", "#4a4a4a", "#7a7168"
TEAL, ORANGE, GREY = "#17868A", "#D2822B", "#9C8F82"


def style_chart(figure, axis):
    """Give a finished chart the site's cream background, light grid and pale frame."""
    figure.patch.set_facecolor(BG)
    axis.set_facecolor(BG)
    axis.grid(True, axis="y", color=GRID, lw=1.0)
    axis.set_axisbelow(True)
    for side in ("top", "right"):
        axis.spines[side].set_visible(False)
    for side in ("left", "bottom"):
        axis.spines[side].set_color(SPINE)
    axis.tick_params(axis="both", labelsize=12.5, colors=TICK)
    axis.xaxis.label.set_color(AXIS_TEXT)
    axis.yaxis.label.set_color(AXIS_TEXT)


lines = [  # the column, its label, its colour, the line style ("-" is solid) and the line width
    ("after the gain", "After the gain", TEAL, "-", 3.2),
    ("similar volatility, smaller gain", "Similar volatility,\nsmaller gain", ORANGE, "-", 3.2),
    # (0, (5, 4)) is dashed: dashes 5 line widths long with gaps of 4, starting with a dash.
    ("all large stocks", "All large stocks", GREY, (0, (5, 4)), 2.0),
]
# figsize is in inches, and dpi=200 when saving gives 2400 by 1600 pixels.
figure, axis = plt.subplots(figsize=(12, 8))
thresholds = rates.index.to_numpy()
for column, label, colour, style, width in lines:
    values = rates[column].to_numpy()
    solid = style == "-"
    # lw is the line width, ls the line style, marker="o" a circle at each point of the solid lines
    # and ms its size. zorder draws higher numbers on top, so the solid lines are drawn over the
    # dashed line.
    axis.plot(thresholds, values, color=colour, lw=width, ls=style, marker="o" if solid else None,
              ms=6.5, zorder=4 if solid else 3)
    # The line's label, to the right of its last point; va="center" centres the text on that point,
    # and linespacing is the distance between the lines of a two-line label, in font sizes.
    axis.text(thresholds[-1] + 12, values[-1], label, color=colour, fontsize=14, va="center",
              linespacing=1.15)
axis.set_xlim(thresholds[0] - 10, thresholds[-1] + 10)
axis.set_ylim(0, 50)
axis.set_xticks(thresholds)
axis.set_xticklabels([f"≥{threshold}" for threshold in thresholds])   # "≥100" reads "at least 100"
axis.yaxis.set_major_locator(mticker.MultipleLocator(10))                   # a tick every 10
axis.set_xlabel("Gain over the previous two years (%)", fontsize=14, labelpad=9)
axis.set_ylabel("Crashed within the next two years (%)", fontsize=14, labelpad=9)
style_chart(figure, axis)
figure.subplots_adjust(left=0.09, right=0.79, bottom=0.13, top=0.96)   # room on the right for labels
figure.savefig("crash_after_gain.png", dpi=200, facecolor=BG)
plt.show()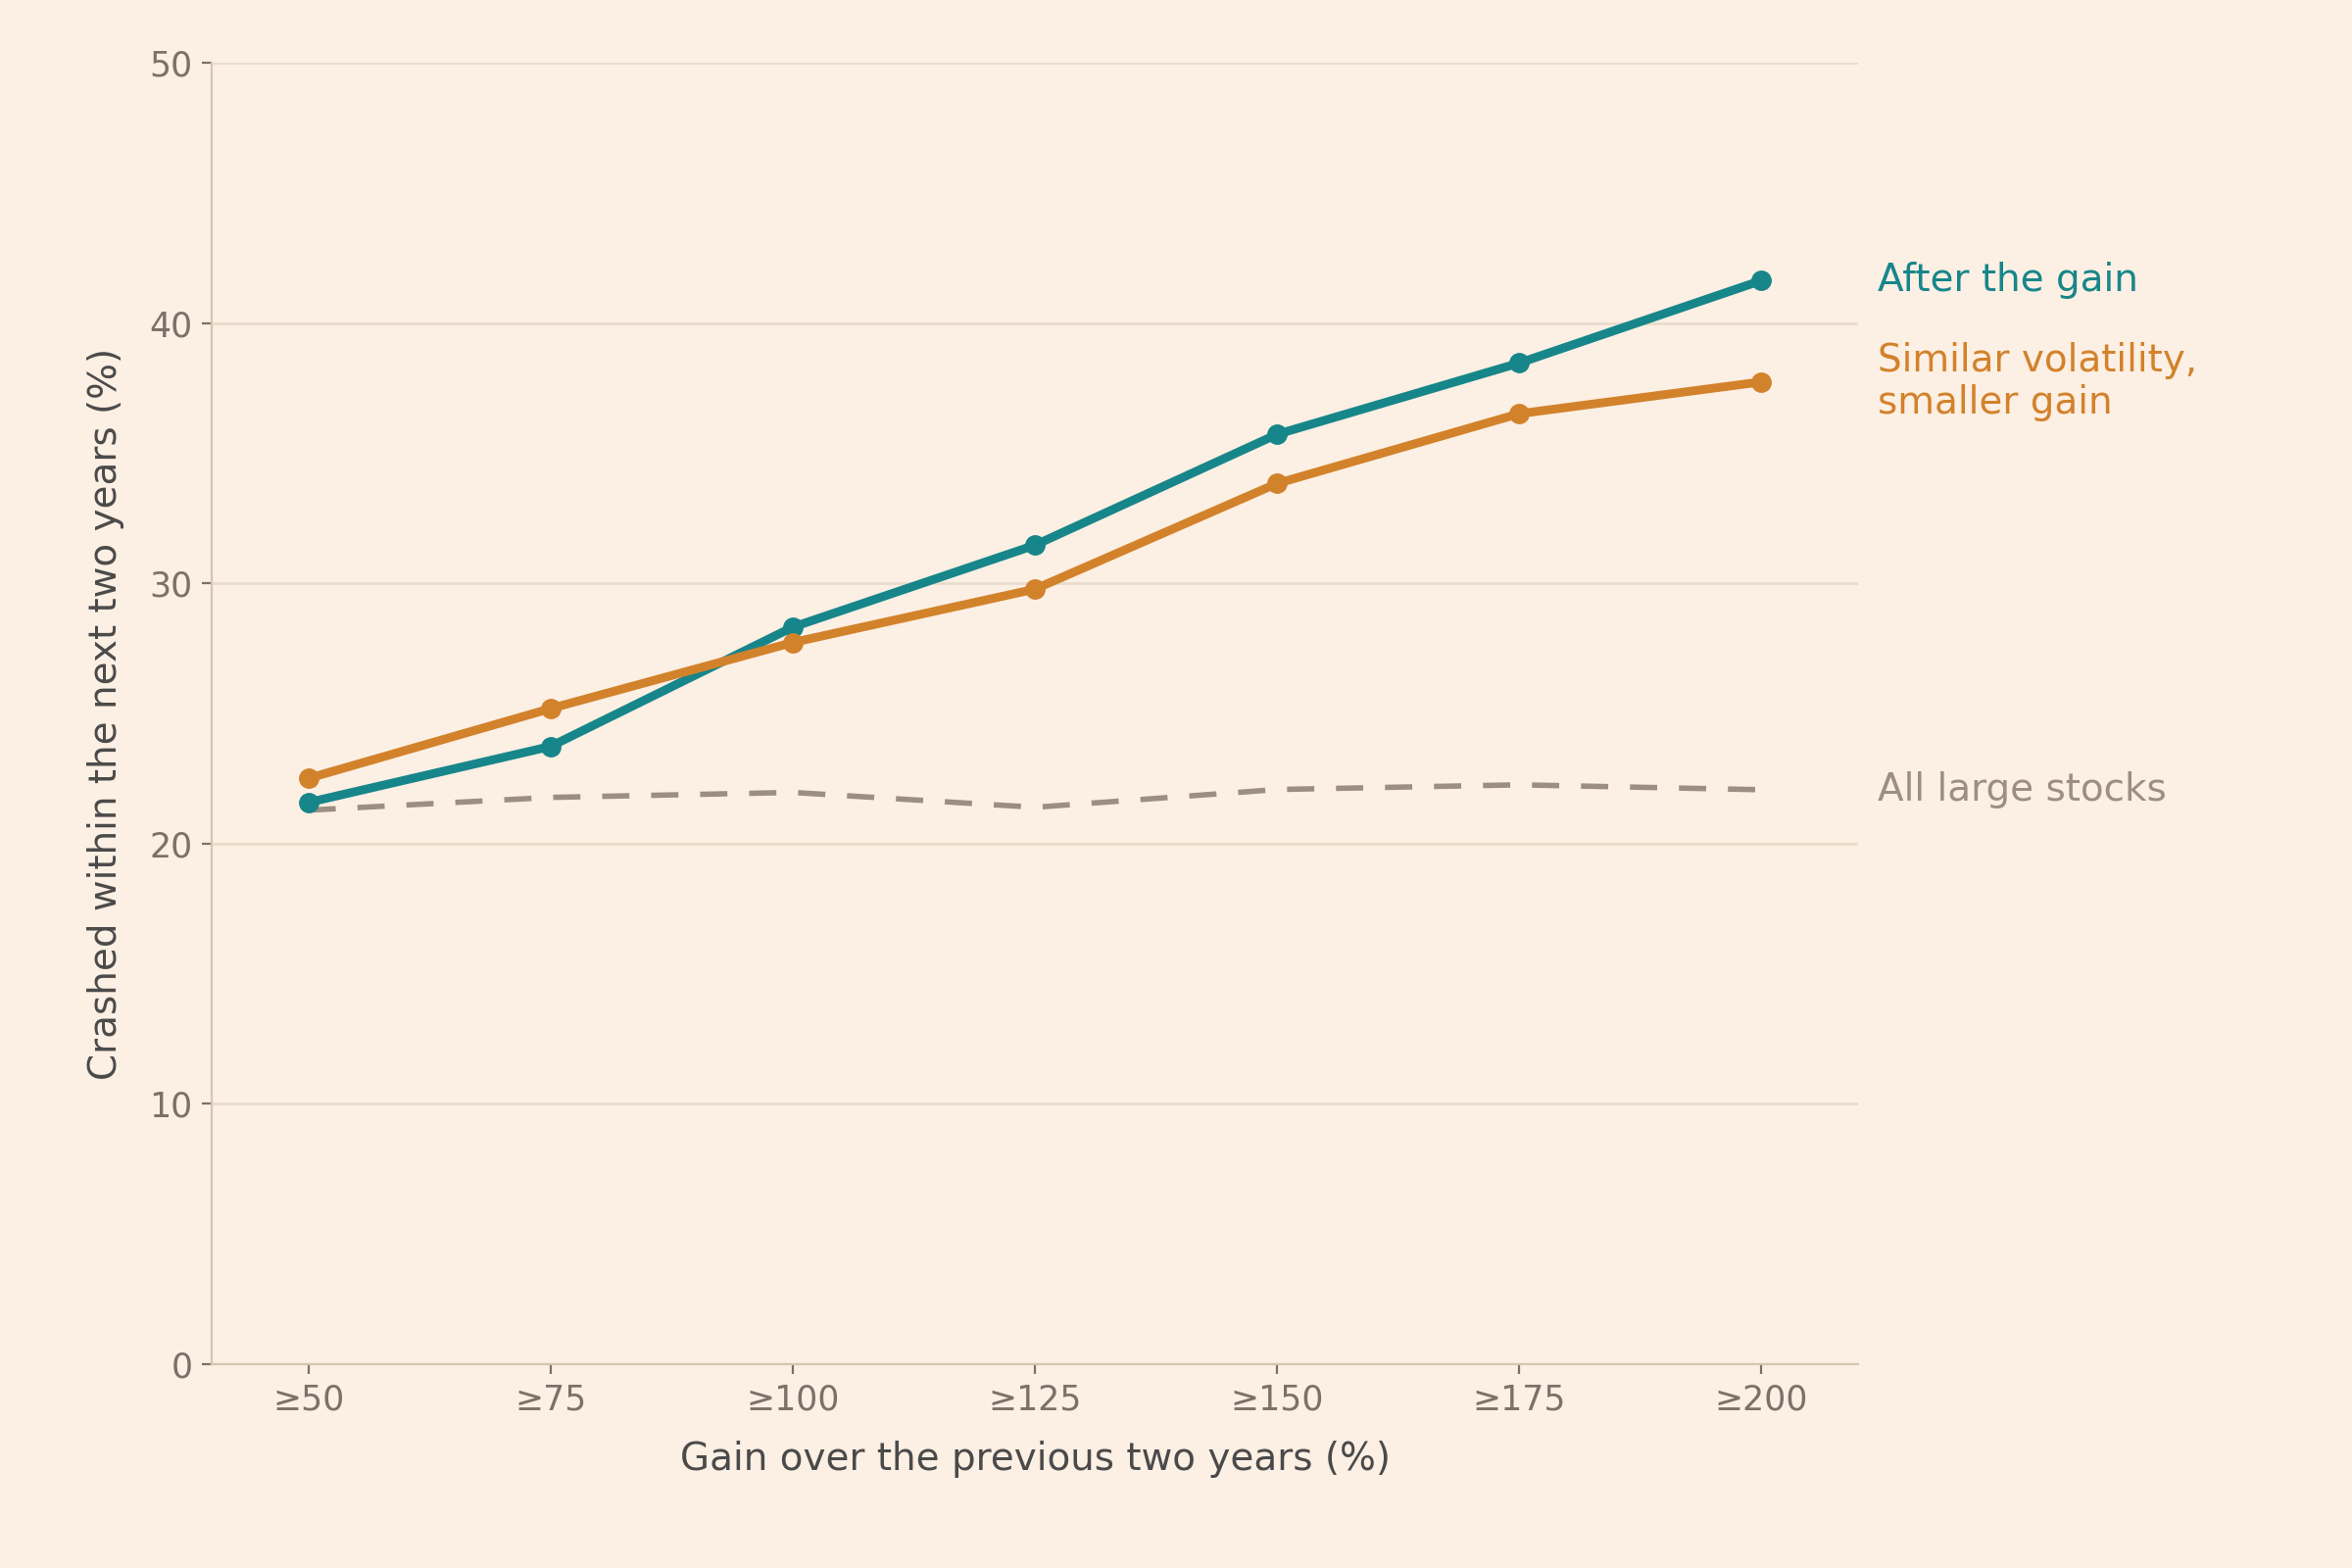
The teal line is the crash rate after the gain, and it increases from 21.6% at a gain of 50% to 41.6% at 200%. The grey dashed line is the crash rate of all large stocks on the same dates, about 22% at every gain. The orange line is the crash rate of the large stocks with similar past volatility and smaller gains, and it increases from 22.5% to 37.7%. So, after big gains the teal line is far above the grey line, and at every gain it is within a few points of the orange line.
Limitations
The windows overlap. Events one month apart share 23 of their 24 months, and the same stock can contribute events at several thresholds. The events are therefore fewer independent observations than their count suggests, and the crash rates here are point estimates, without confidence intervals, ranges that likely contain the true values.
Month-end values. The crash rates count only falls that show at month-ends, so a fall that reverses within a month is missed, and the share missed can differ between the three groups.
Delistings and security types. The data has no return for the days after a delisting, so a stock that delisted counts as cash at its last value, whatever its shareholders finally received. The data records security types only for stocks listed by January 2000, so funds and similar securities listed later stay among the large stocks.
What the comparison shows. Most of the higher crash rate after a big gain also appears among stocks with similar past volatility and smaller gains. The comparison does not show why, and after the largest gains the crash rate was still a few points higher than that of the stocks with similar past volatility and smaller gains.
Conclusion
Large US stocks that had doubled over two years crashed more often in the next two years than large stocks in general, 28.3% against 22.0% on the same dates. Large stocks with similar past volatility that had gained less than 100% crashed 27.7% of the time, and at the larger gains their crash rate was within a few points of the rate after the gain. The takeaway is that stocks crashed more often after a big gain, but about as often as we would expect from how volatile they were.
Read next
- Buy the dip? US vs. Europe What followed large falls, the opposite move.
- Download stock data from LSEG Workspace in Python The pipeline that builds the daily data behind this post.
Disclaimer: this is a descriptive historical test for discussion purposes only. Not investment advice. Past performance does not guarantee future returns.
Data: daily total returns, market values, and bid and ask prices of US stocks from LSEG Workspace (licensed). Because the data is licensed, I do not reproduce the raw files here. The question and the 40% crash threshold come from Greenwood, Shleifer and You (2019), “Bubbles for Fama”, Journal of Financial Economics 131(1), 20 to 43, which studies US industries; this post adapts their test to single large stocks.