What do you own in emerging markets?
An index fund holds the stocks in its index. So what you own through an emerging-markets fund changes as companies join and leave the index, and as their stocks rise and fall in value.
I look at the stocks that iShares’ emerging-markets fund held at the end of every year from 2007 to 2025 and on 30 September 2026. The fund is the iShares MSCI Emerging Markets ETF, ticker EEM. It is an exchange-traded fund, bought and sold on a stock exchange like a company’s stock. EEM follows MSCI’s index of the large and mid-sized companies in emerging markets. I put each stock in one of four groups: technology, energy and materials, financials, and everything else.
At the end of 2007, technology companies were 14% of the value of the fund’s stocks. On 30 September 2026, they were 49%. Over the same years, the share of energy and materials companies decreased from 34% to 9%.
Every stock goes into one of four groups
iShares publishes the holdings of its funds for past dates, one file per trading day. I use the file for the last trading day of each year and for 30 September 2026. I start at the end of 2007, the first year-end whose file gives each stock’s sector.
MSCI and S&P maintain a classification that sorts companies into sectors by their main business. In September 2018, the classification moved the internet companies out of Information Technology. Tencent went to Communication Services, and Alibaba to Consumer Discretionary.
Each stock goes into a group by its company’s sector. Technology is the Information Technology sector together with the 12 companies that EEM listed under Information Technology at the end of 2017 and under Communication Services or Consumer Discretionary at the end of 2018. Those 12 companies count as technology at every date. Energy and materials is the Energy sector and the Materials sector together. Financials is the Financials sector and the Real Estate sector together, because Real Estate was part of Financials until 2016. Everything else is the six other sectors together: Communication Services, Consumer Discretionary, Consumer Staples, Health Care, Industrials and Utilities.
I show the code without running it here, with the output of my run. The code that downloads the files and puts each stock in its group runs first and is in the appendix.
Technology went from the smallest group to the largest
The chart stacks the four groups’ shares at each date, with technology at the bottom. Technology was the smallest group at the end of 2007 and the largest in September 2026.
def style_chart(figure, axis):
    """Give a finished chart the site's cream background, light grid and pale frame."""
    figure.patch.set_facecolor(BG)
    axis.set_facecolor(BG)
    axis.grid(True, axis="y", color=GRID, lw=1.0)
    axis.set_axisbelow(True)
    for side in ("top", "right"):
        axis.spines[side].set_visible(False)
    for side in ("left", "bottom"):
        axis.spines[side].set_color(SPINE)
    axis.tick_params(axis="both", labelsize=12.5, colors=TICK)
    axis.xaxis.label.set_color(AXIS_TEXT)
    axis.yaxis.label.set_color(AXIS_TEXT)


COLOURS = {"Technology": TEAL, "Energy and materials": ORANGE, "Financials": GREY,
           "Everything else": PALE}
# The label of the pale group is in a darker shade, so that it can be read on the cream
LABEL_COLOURS = {"Technology": TEAL, "Energy and materials": ORANGE, "Financials": GREY,
                 "Everything else": TICK}
# The labels beside the last bar. "\n" starts a new line, so that the longest label fits
CHART_LABELS = {"Technology": "Technology", "Energy and materials": "Energy and\nmaterials",
                "Financials": "Financials", "Everything else": "Everything else"}
# plt.subplots makes a figure with one chart in it, and figsize is its size in inches
figure, axis = plt.subplots(figsize=(12, 8))
positions = np.arange(len(shares))                   # 0, 1, 2 and so on, one position per bar
bottom = np.zeros(len(shares))                       # where each bar's next part starts
for group in GROUPS:
    # The group's part of each bar starts where the parts below it end, and zorder=3 draws the
    # bars in front of the grid lines
    axis.bar(positions, shares[group], bottom=bottom, color=COLOURS[group], width=0.72, zorder=3)
    # The group's label beside the last bar, at the middle of its part. va="center" centres the
    # text on that height
    label_height = bottom[-1] + shares[group].iloc[-1] / 2
    axis.text(positions[-1] + 0.55, label_height, CHART_LABELS[group], color=LABEL_COLOURS[group],
              fontsize=14, va="center")
    bottom = bottom + shares[group].to_numpy()
# Every other year has a label, and so does the last bar, so that the labels do not run into
# each other. enumerate counts the labels from 0, and % 2 is the remainder after dividing by 2,
# which is 0 for every other label
tick_labels = []
for number, label in enumerate(shares.index):
    is_last_bar = number == len(shares) - 1
    is_every_other = number % 2 == 0 and number < len(shares) - 2
    if is_last_bar or is_every_other:
        tick_labels.append(label.replace(" ", "\n"))    # "Sep 2026" on two lines
    else:
        tick_labels.append("")
axis.set_xticks(positions)
axis.set_xticklabels(tick_labels, fontsize=12.5)
axis.set_ylim(0, 100)
# labelpad=9 is the gap between the label and the axis, in points of 1/72 inch
axis.set_ylabel("Share of the value of the fund's stocks (%)", fontsize=14, labelpad=9)
style_chart(figure, axis)
# subplots_adjust sets the margins as shares of the figure, with room on the right for the labels
figure.subplots_adjust(left=0.08, right=0.83, bottom=0.11, top=0.96)
# dpi=200 saves 200 dots per inch, and facecolor=BG gives the saved image the cream background
figure.savefig(CHART_FILE, dpi=200, facecolor=BG)
plt.show()                                           # shows the chart below the cell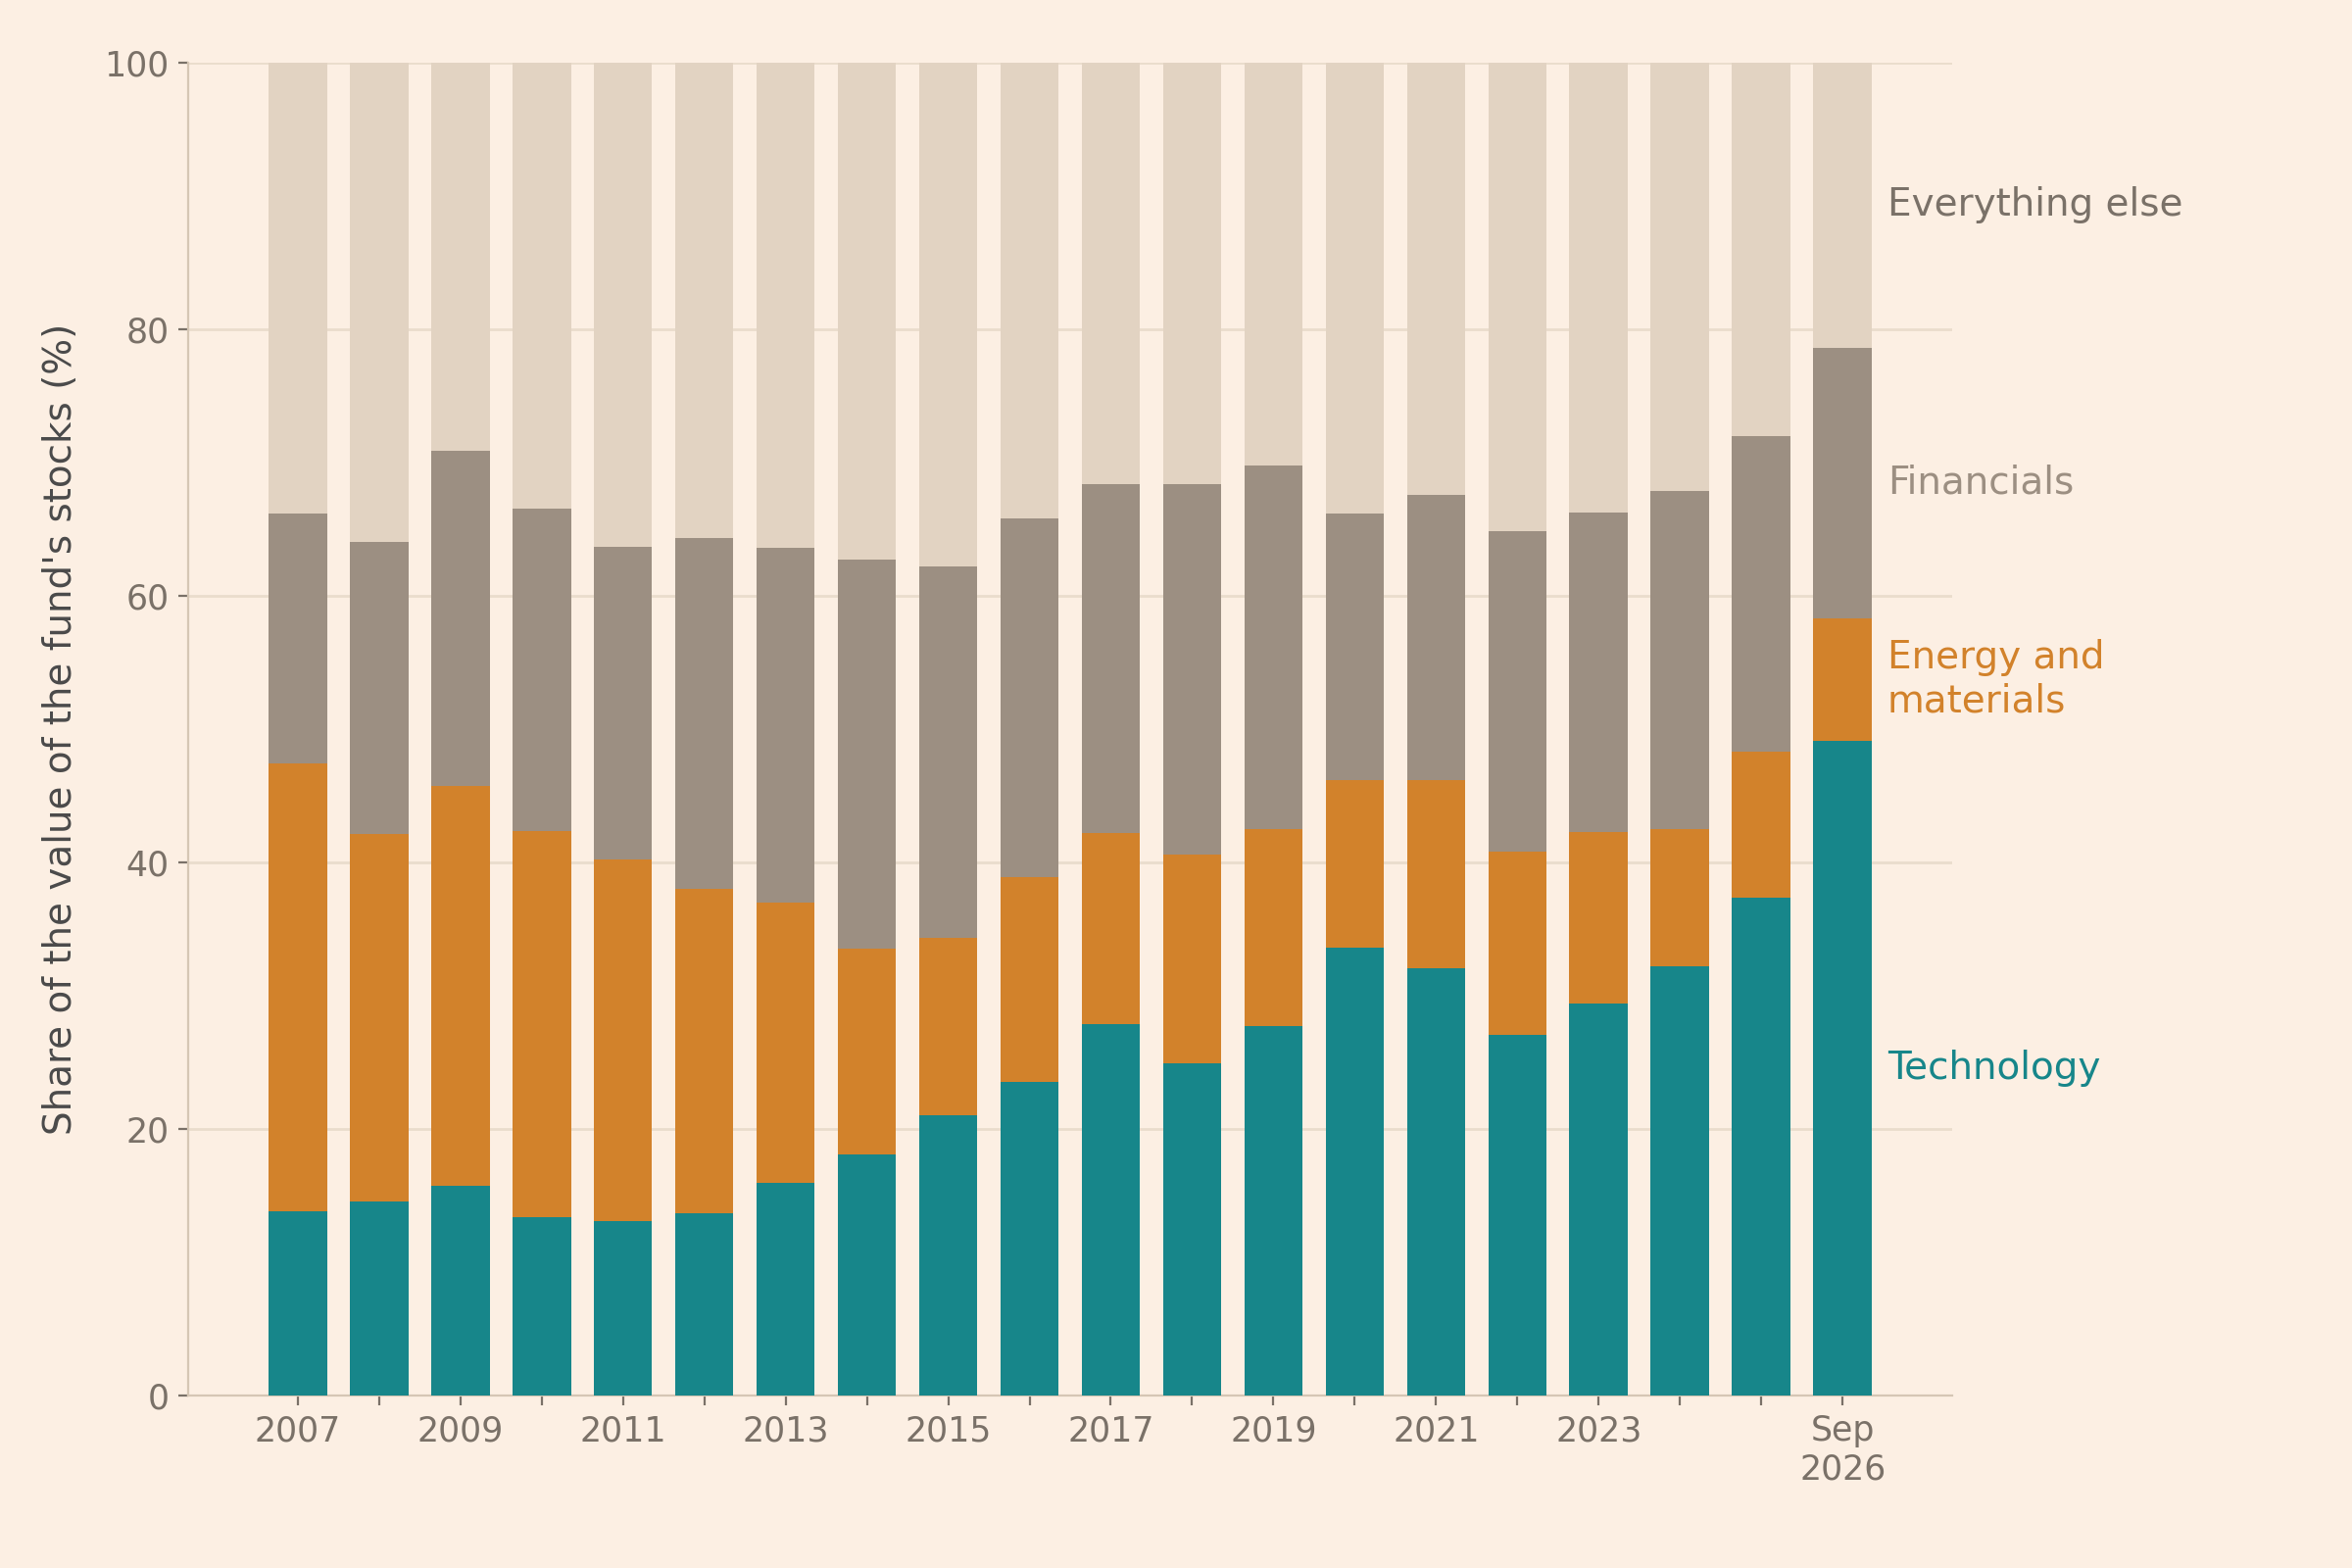
Limitations
EEM is one fund, seen once a year. Other emerging-markets funds can follow other indexes and hold other companies. The year-end files also miss what happens between two year-ends.
The technology group leaves out some internet companies. Besides the Information Technology sector, it holds only the 12 companies found in the 2017 and 2018 files. Other internet companies outside Information Technology, including those that EEM bought after 2017, stay in their own sectors. So the share would be higher if the group took in every internet company.
The shares leave out cash and futures. The fund’s stocks were between 94.8% and 100.1% of the whole fund’s value. They can be worth more than the whole fund, because the fund’s value is its stocks, cash and futures less its debts. So measured against the whole fund, each share would be between 0.948 and 1.001 times as large.
Conclusion
The takeaway is that the fund kept its name while its companies changed. If you held it at the end of 2007, you owned mostly energy, materials and financial companies. If you held it in September 2026, you owned mostly technology and financial companies.
Appendix: how the code builds the groups
The code below runs first. It downloads the holdings and puts each stock in its group.
The settings
The first block sets the file names, the dates and the chart colours.
from pathlib import Path
import re
import time

import matplotlib.pyplot as plt
import numpy as np
import pandas as pd
import requests

# Path.cwd() is the folder this notebook runs in, and / joins a folder and a file name
FOLDER = Path.cwd()
HOLDINGS_FOLDER = FOLDER / "holdings"                # one saved iShares file per date
CHART_FILE = FOLDER / "emerging_markets_sector_mix.png"

FUND, PORTFOLIO = "EEM", 239637                      # the fund and iShares' number for it
FUND_NAME = "iShares MSCI Emerging Markets ETF"      # the first line of each of its files
FIRST_YEAR, LAST_YEAR = 2007, 2025                   # the year-ends
LATEST = pd.Timestamp("2026-09-30")                  # a date, the latest month-end
LOOK_BACK = 7                                        # days tried before a date, to find a file
# format() fills in {portfolio} and {date:%Y%m%d} later, and %Y%m%d writes a date as 20071231
URL = ("https://www.ishares.com/varnish-api/blk-one01-product-data/product-data/api/v1/"
       "get-fund-document?appType=PRODUCT_PAGE&appSubType=ISHARES&targetSite=us-ishares"
       "&locale=en_US&portfolioId={portfolio}&userType=individual&component=holdings"
       "&asOfDate={date:%Y%m%d}")

# The four groups, from the bottom of each bar to the top
GROUPS = ["Technology", "Energy and materials", "Financials", "Everything else"]

# The site's chart colours: the cream background, the light grid lines, the pale frame, the axis
# labels and the tick labels, then the four groups
BG, GRID, SPINE = "#FCEFE3", "#EADCCC", "#D5C6B4"
AXIS_TEXT, TICK = "#4a4a4a", "#7a7168"
TEAL, ORANGE, GREY, PALE = "#17868A", "#D2822B", "#9C8F82", "#E2D3C2"
The code downloads each file once
For each date, the code takes the file of the last trading day, which is the date itself or the closest earlier day with a file, up to a week back. The code saves each file in a holdings folder, so a later run downloads nothing. On a weekend or holiday, iShares answers with a file that names the fund and gives “-” as its date. The code saves that file too and tries the day before. It asks iShares for at most one file a second. Any other unexpected answer stops the run, such as an error, a file for another fund or another date, or a file without stocks.
# mkdir makes the folder, and exist_ok=True lets it exist already
HOLDINGS_FOLDER.mkdir(exist_ok=True)


def holdings_on(date):
    """EEM's stocks on one date, from the saved file or else downloaded and saved.
    holdings_on(pd.Timestamp("2007-12-31")) gives a table with one row per stock: its ticker,
    name, sector, weight in % and market value in dollars. On a weekend or holiday, iShares
    answers with a file whose date is "-", and then the function gives None, so that the day
    before can be tried. Any other unexpected answer stops the run."""
    path = HOLDINGS_FOLDER / f"{FUND}_{date:%Y%m%d}.csv"
    if not path.exists():
        response = requests.get(URL.format(portfolio=PORTFOLIO, date=date),
                                headers={"User-Agent": "Mozilla/5.0 (academic research)"},
                                timeout=60)
        response.raise_for_status()                  # stop if iShares answers with an error
        time.sleep(1)                                # at most one request a second
        # utf-8-sig drops the mark that some files start with
        if not response.content.decode("utf-8-sig").startswith(FUND_NAME):
            raise RuntimeError(f"iShares' answer for {date:%Y-%m-%d} does not name {FUND_NAME}")
        path.write_bytes(response.content)            # saved, a day without holdings too
    # The first line names the fund, and the second gives the date of the holdings
    lines = path.read_text(encoding="utf-8-sig").splitlines()
    if len(lines) < 2 or lines[0] != FUND_NAME:
        raise RuntimeError(f"{path.name} does not name {FUND_NAME}")
    if lines[1] == 'Fund Holdings as of,"-"':
        return None                                  # a weekend or holiday, without holdings
    expected_date = f'Fund Holdings as of,"{date:%b %d, %Y}"'   # %b %d, %Y writes Dec 31, 2007
    if lines[1] != expected_date:
        raise RuntimeError(f"{path.name} gives another date: {lines[1]}")
    # The table starts on the tenth line, and thousands="," reads 1,494.50 as 1494.5
    table = pd.read_csv(path, skiprows=9, thousands=",")
    # DataFrame.loc[rows, columns] selects rows and columns, here the stocks and five columns
    stocks_held = table.loc[table["Asset Class"] == "Equity",
                            ["Ticker", "Name", "Sector", "Weight (%)", "Market Value"]]
    if stocks_held.empty:                            # empty is True for a table without rows
        raise RuntimeError(f"{path.name} lists no stocks")
    return stocks_held


# The dates to look up are each year-end, then the latest month-end. A list starts empty, and
# append adds one date at a time. range stops before its end, hence LAST_YEAR + 1
targets = []
for year in range(FIRST_YEAR, LAST_YEAR + 1):
    targets.append(pd.Timestamp(f"{year}-12-31"))
targets.append(LATEST)

# For each target date, the first day with holdings, going back from the target itself past
# weekends and holidays, at most LOOK_BACK days. pd.Timedelta(days=back) is a length of time of
# back days, and break leaves the inner loop once a day with holdings is found
tables = []
for target in targets:
    table = None
    for back in range(LOOK_BACK + 1):
        date = target - pd.Timedelta(days=back)
        table = holdings_on(date)
        if table is not None:
            # assign adds two columns, the date asked for and the date of the file
            tables.append(table.assign(target=target, date=date))
            break
    if table is None:
        raise RuntimeError(f"no holdings file in the week before {target:%Y-%m-%d}")
# concat stacks the tables, and ignore_index=True numbers the rows afresh
holdings = pd.concat(tables, ignore_index=True)
# nunique() counts the different values
print(f"Dates with holdings: {holdings['date'].nunique()}, from "
      f"{holdings['date'].min():%Y-%m-%d} to {holdings['date'].max():%Y-%m-%d}")
Dates with holdings: 20, from 2007-12-31 to 2026-09-30The 12 internet companies count as technology
The last block finds the 12 internet companies by their names and counts them as technology at every date. Every other stock goes into its group by its sector.
# The internet companies that the classification moved out of Information Technology in
# September 2018 are those that EEM listed under Information Technology at the end of 2017 and
# under Communication or Consumer Discretionary at the end of 2018, matched by their name keys
end_2017 = holdings.loc[holdings["target"] == pd.Timestamp("2017-12-31")]
end_2018 = holdings.loc[holdings["target"] == pd.Timestamp("2018-12-31")]
tech_in_2017 = set(end_2017.loc[end_2017["Sector"] == "Information Technology", "key"])
in_internet_sectors = end_2018["Sector"].isin(["Communication", "Consumer Discretionary"])
internet_sectors_in_2018 = set(end_2018.loc[in_internet_sectors, "key"])
# & keeps the names in both sets, and sorted makes a list of them in alphabetical order
internet_companies = sorted(tech_in_2017 & internet_sectors_in_2018)
print(f"Internet companies moved out of Information Technology in 2018: "
      f"{len(internet_companies)}")

# map gives each sector its group, and fillna puts the other sectors, and the holdings without a
# sector, in "Everything else"
GROUP_OF_SECTOR = {"Information Technology": "Technology", "Energy": "Energy and materials",
                   "Materials": "Energy and materials", "Financials": "Financials",
                   "Real Estate": "Financials"}
holdings["group"] = holdings["Sector"].map(GROUP_OF_SECTOR).fillna("Everything else")
# The internet companies count as technology at every date
is_internet = holdings["key"].isin(internet_companies)
holdings.loc[is_internet, "group"] = "Technology"
print(f"Rows of those companies counted as technology: {is_internet.sum()}, at "
      f"{holdings.loc[is_internet, 'date'].nunique()} of the {holdings['date'].nunique()} dates")
Internet companies moved out of Information Technology in 2018: 12
Rows of those companies counted as technology: 134, at 20 of the 20 datesRead next
- How do ETFs work? Creation and redemption, step by step Why an ETF’s price stays close to the value of its stocks.
- How much growth is there in growth stocks? What the most expensive fifth of large US stocks grew and returned.
- How smart are smart beta ETFs? What ETFs that choose their stocks by rules returned against their benchmarks.
- Does announcing trades still hurt index investors? Another study built from iShares’ holdings files.
Disclaimer: an empirical study for discussion purposes, not investment advice. The design is descriptive and not causal. Past performance does not guarantee future returns.
Sources: holdings of the iShares MSCI Emerging Markets ETF (EEM) from the files iShares publishes for past dates, at each year-end from 2007 to 2025 and on 30 September 2026. The sectors follow the Global Industry Classification Standard of MSCI and S&P Dow Jones Indices, whose September 2018 change moved the internet companies out of Information Technology. I do not reproduce the raw holdings here.