Expensive IPOs are a free lunch for about a day
Expensive IPOs are a free lunch for about a day. I have lost count of the times I have seen a newspaper warn against subscribing to a pricey IPO, only to watch it open well above its offer. That jump from the offer to the first trade is a free lunch for anyone allocated at the offer, and the question is how long it lasts.
The first-day IPO pop is a size threshold. US IPOs below about half a billion dollars at the offer barely moved on day one, and above that line the median pop settled near 13 percent and stopped climbing. I test whether an IPO’s debut size and its valuation predict the pop and the first year that follows.
Across 2,417 US IPOs from 2000 to 2026, the smallest fifth by debut size opened a median of 0.2 percent above the offer. The middle fifth opened 10.7 percent above it. The two largest buckets opened 12.7 percent and 13.9 percent above. So, the pop is a threshold that switches on near half a billion dollars of size, then stops climbing.
The first year did not follow size. The smallest fifth finished down a median 14.8 percent, the worst of the five. Sorting the same IPOs by valuation instead sorted the first year cleanly: among the companies that were profitable at the offer, the cheapest returned a median 13.0 percent over year one and the priciest lost 2.1 percent.
The setup
- Universe: US IPOs from 2000 to 2026, active and delisted, each with a real offer price and a first-trade opening print. I keep the 2,417 debuts that are at least one year old.
- Size: offer-implied market cap, the day-1 share count repriced at the offer, deflated to 2026 dollars.
- Valuation: offer-implied price-to-earnings (P/E), the offer-priced company over its last reported annual earnings, with loss-makers held as their own bucket.
- Returns: the first-day pop from the offer to the opening trade, then the median return from the day-1 close over the next month and the next year.
- Sample rule: only debuts at least one year old, so the one-year column covers the same set of companies as every other column.
Starting point
The analysis runs off one file the builder notebook produces. I pull from LSEG Workspace. Because the data is licensed, the raw file stays off this page, and I show the code without running it here. The download route is the one from an earlier post, with the field list set to IPO offer prices, opening prints, market caps, and fundamentals.
Step 1. Size at the offer price
The size measure is offer-implied market cap: the share count LSEG used on day one, repriced at the offer price from the night before. Day-1 market cap already contains the pop I am measuring. A stock that pops 100 percent doubles its “size” before the sort, which pushes the biggest poppers into the top bucket and builds a fake size-to-pop gradient. Repricing the same share count at the offer removes that contamination.
import pandas as pd

df = pd.read_csv("ipo_data.csv", parse_dates=["first_trade_date"])

# Offer-implied size: the day-1 share count repriced at the offer.
# Day-1 market cap already contains the pop, so sorting on it would bake the
# pop into the buckets and manufacture a size-to-pop gradient.
df["offer_implied_mcap"] = (df["market_cap_usd"] / df["day1_close"]) * df["offer_price"]

# The first-day pop: offer price to the opening trade.
df["pop_open"] = (df["day1_open"] / df["offer_price"] - 1) * 100

# Keep research-grade rows: a real offer, an opening print, a known size, and a
# debut at least a year old so the one-year column covers a single cohort.
cutoff = pd.Timestamp.now().normalize() - pd.Timedelta(days=365)
d = df[(df["offer_price"] > 0) & df["day1_open"].notna()
       & df["offer_implied_mcap"].notna()
       & (df["first_trade_date"] <= cutoff)].copy()
The seasoning rule matters for a plain reason. An IPO from six months ago has no true one-year return, so keeping it would let the one-year column describe a younger cohort than every other column. The cutoff moves with the calendar, so re-running later admits newly seasoned IPOs on its own.
Step 2. Same dollars, five buckets
A 500-million-dollar IPO in 2000 was a bigger company than a 500-million-dollar IPO in 2024, because a dollar bought more then. Without an inflation adjustment, the small bucket would fill with old IPOs and the large bucket with recent ones, mixing size with era. I deflate every debut size to 2026 dollars with annual consumer-price index (CPI) factors, then cut the ranked sizes into five equal-count buckets.
# A $500m IPO in 2000 was a bigger company than a $500m IPO in 2024, because a
# dollar bought more then. Deflate every debut size to 2026 dollars before sorting.
d["year"] = d["first_trade_date"].dt.year
d["real_mcap"] = d["offer_implied_mcap"] * d["year"].map(lambda y: CPI[2026] / CPI[y])

# Rank by real size and cut the ranks into five equal-count buckets.
labels = ["Q1 smallest", "Q2", "Q3", "Q4", "Q5 largest"]
d["size_q"] = pd.qcut(d["real_mcap"], 5, labels=labels)
I use qcut, which cuts the ranks into equal-count groups, because IPO sizes are heavily skewed and a range cut would pile nearly every name into the bottom bin. The buckets end up at about 484 IPOs each, running from a median of 129.3 million dollars in Q1 to 4.2 billion in Q5.
Step 3. What each size bucket returned
I report the median, because IPO outcomes have long right tails and the median is what the typical IPO in the bucket did. The one-month and one-year returns start at the day-1 close, so they exclude the pop and compound on top of it.
def bucket_stats(g):
    return pd.Series({
        "n": len(g),
        "size_med_$m": g["real_mcap"].median() / 1e6,   # typical deflated size
        "pop_%": g["pop_open"].median(),                # median first-day pop
        "ret_1m_%": g["ret_1m_pct"].median(),           # median return, day-1 close to +1 month
        "ret_1y_%": g["ret_1y_pct"].median(),           # median return, day-1 close to +1 year
        "up_1y_%": (g["ret_1y_pct"].dropna() > 0).mean() * 100,
    })

tab = d.groupby("size_q", observed=True).apply(bucket_stats).round(1)
n size_med_$m pop_% ret_1m_% ret_1y_% up_1y_%
Q1 smallest 484 129.3 0.2 -1.4 -14.8 36.1
Q2 483 374.3 3.5 1.9 1.9 51.9
Q3 483 654.7 10.7 1.5 -6.3 43.7
Q4 483 1261.2 12.7 2.5 1.8 51.8
Q5 largest 484 4227.9 13.9 1.8 -8.2 43.8The pop climbs from 0.2 percent in the smallest bucket to 10.7 percent in the middle one, then flattens at 12.7 and 13.9 percent for the two largest. So, bookbuilt deals above about half a billion dollars get priced to pop, and the smallest deals do not.
The first year did not follow size. The smallest fifth finished down a median 14.8 percent, the worst of the five, and only 36.1 percent of it finished above the day-1 close. The largest fifth finished down 8.2 percent. Size sorted the day-one pop cleanly. It left the first-year return unsorted.
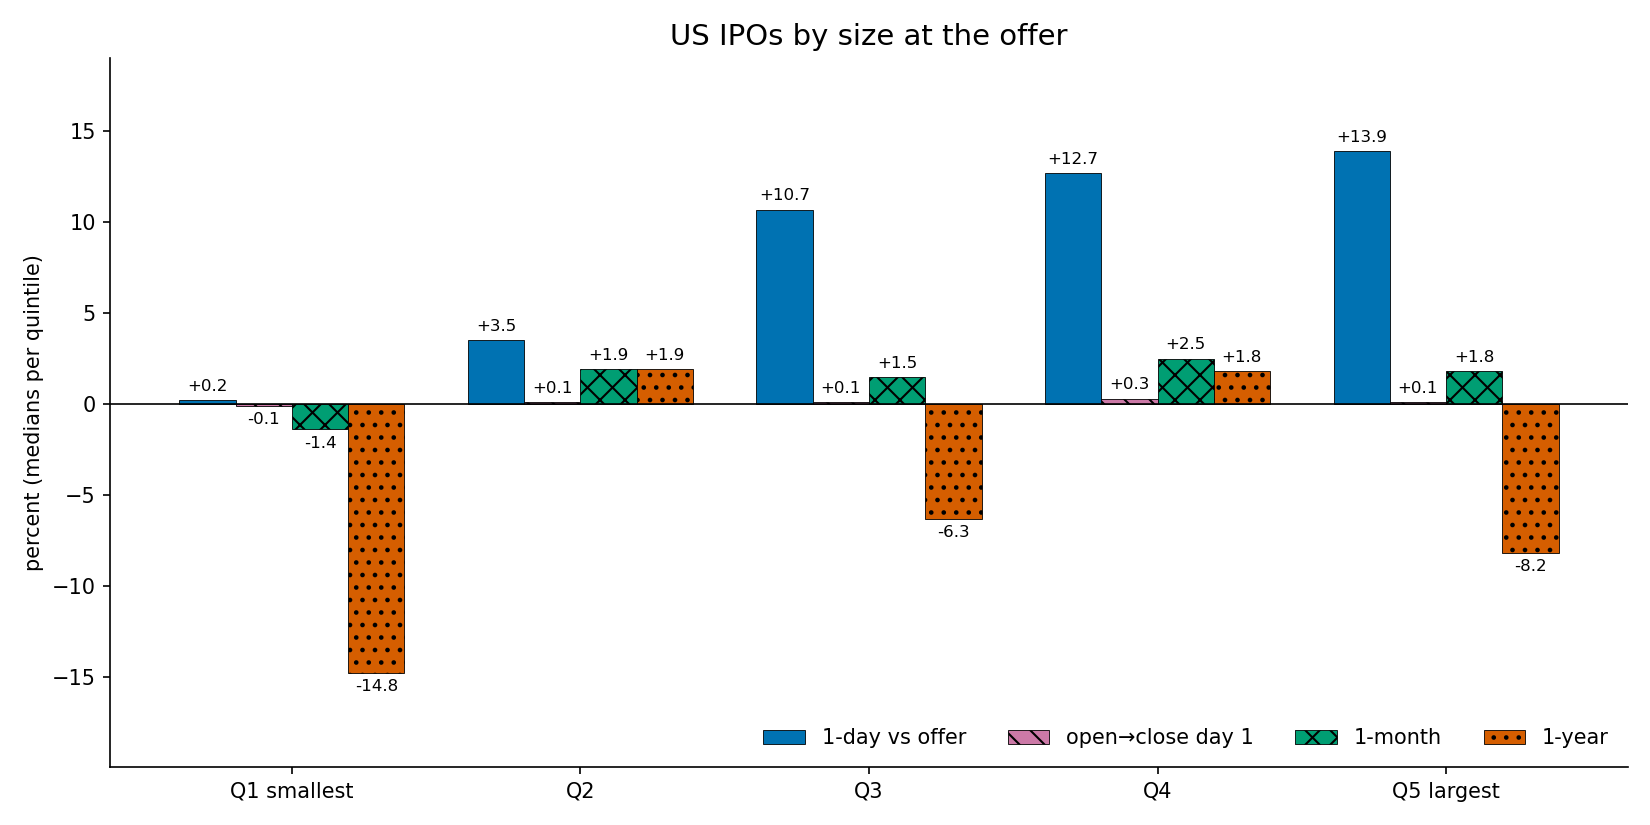
The pop went to investors allocated shares at the offer. A buyer at the opening trade earned close to nothing on day one: the median open-to-close move stayed within 0.3 percent of zero in every size bucket.
Step 4. Sort by valuation instead
The same four bars, this time with the buckets set by price. I keep two design choices for the same reasons as the size sort. The P/E uses the offer price, so the pop does not leak into the valuation. And loss-makers get their own bucket, because IPOs without positive earnings are the majority of the sample.
import numpy as np

# Offer-implied P/E: the offer-priced company over its last reported annual earnings.
d["pe_offer"] = np.where(d["net_income_fy0"] > 0,
                         d["offer_implied_mcap"] / d["net_income_fy0"], np.nan)

# Loss-makers are their own bucket; the profitable split into four P/E quartiles.
loss = d["net_income_fy0"] <= 0
prof = d["pe_offer"].notna()
pe_labels = ["P/E Q1 cheapest", "P/E Q2", "P/E Q3", "P/E Q4 priciest"]
d.loc[loss, "vq"] = "Loss-making"
d.loc[prof, "vq"] = pd.qcut(d.loc[prof, "pe_offer"], 4, labels=pe_labels)

tab_pe = d[d["vq"].notna()].groupby("vq", observed=True).apply(bucket_stats).round(1)
Of the 2,417 IPOs, 1,289 were loss-making at the offer, 909 were profitable with a usable P/E, and 219 dropped out with no earnings record or a currency mismatch, mostly funds and shell companies. The table adds each bucket’s median P/E.
                    n   pe_med   pop_%   ret_1m_%   ret_1y_%   up_1y_%
Loss-making      1289        —     9.4       -0.3      -20.6      37.5
P/E Q1 cheapest   228     10.1     5.3        3.5       13.0      65.5
P/E Q2            227     23.6     8.3        3.3       11.6      60.2
P/E Q3            227     49.4     8.8        3.7        3.6      53.3
P/E Q4 priciest   227    167.6    13.2        2.6       -2.1      48.0
Among the profitable IPOs, the first-year return falls straight down the valuation ladder. The cheapest quarter, at a median P/E of 10.1, returned a median 13.0 percent, and 65.5 percent of them finished up. The return drops to 11.6, then 3.6, and turns to a 2.1 percent loss for the priciest quarter, at a median P/E of 167.6. The loss-makers, just over half the sample, lost the most at 20.6 percent, and only 37.5 percent of them finished up, even though they popped a median 9.4 percent on day one.
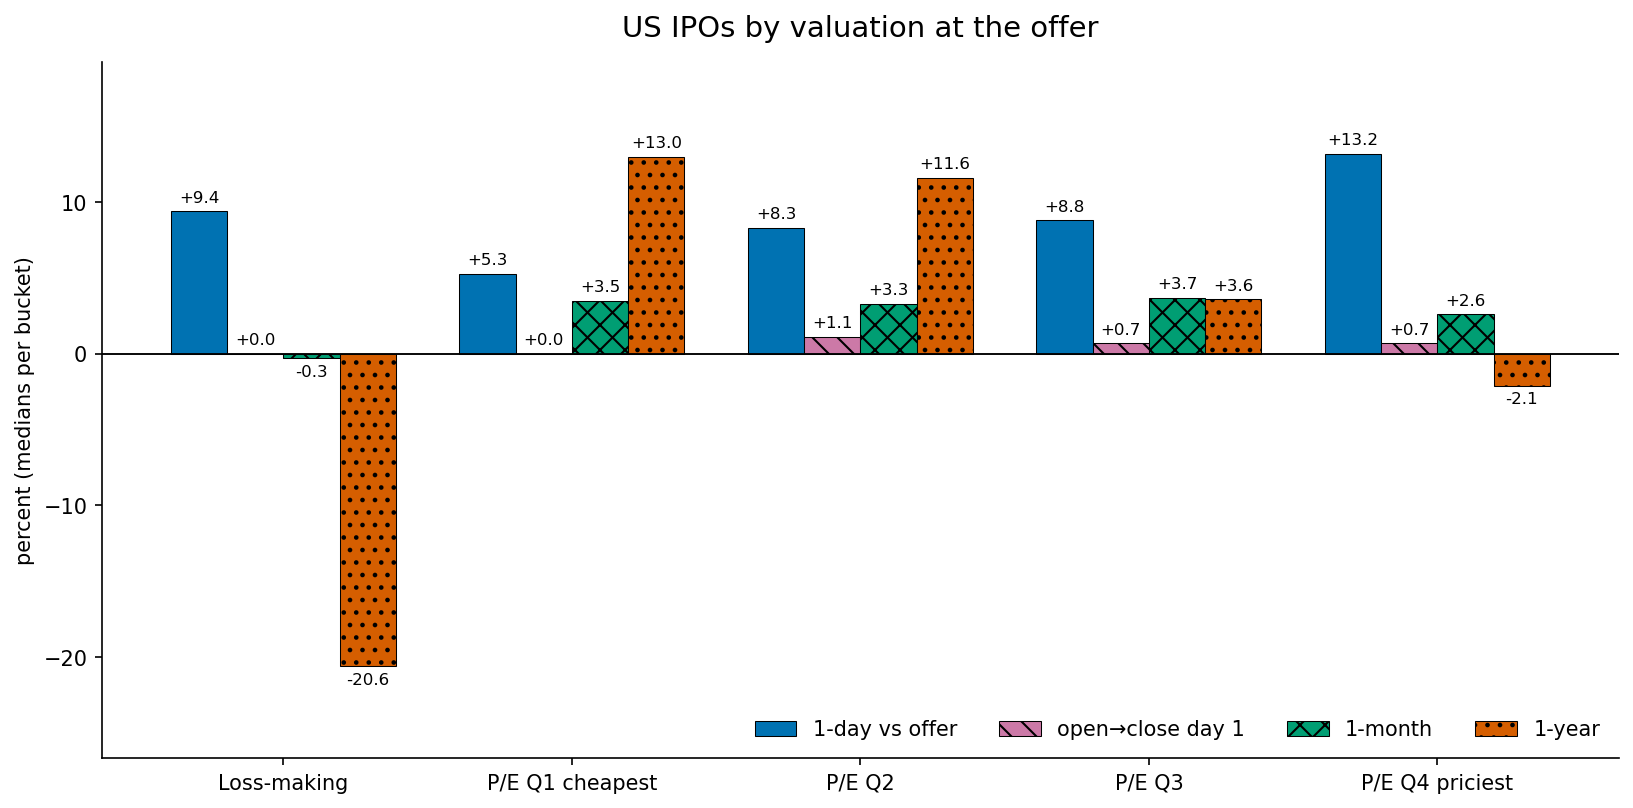
The priciest quarter and the loss-makers popped the hardest on day one, at 13.2 and 9.4 percent, and finished the year the worst. So, the market paid the most on day one for the deals that did worst over the year.
What this test does not settle
- Returns start at the day-1 close. I measure the one-month and one-year figures from the opening close, so they exclude the pop. The pop went only to investors allocated shares at the offer, and a buyer at the open earned close to nothing on day one.
- These are raw returns. I report each IPO’s own return from the day-1 close, without subtracting the market over the same window. A minus 14.8 percent year means one thing in a rising market and another in a falling one, so setting each return against the S&P 500 total return over the identical window is a separate test and is not in this post.
- Survivorship flatters the small bucket. The sample rescues 1,138 delisted IPOs. It still drops delisted names that carry no listing dates in the vendor file, and those skew small. So, the smallest bucket’s outcomes read better here than the full population would show.
- One specification, pooled across 26 years. The quintiles pool every IPO from 2000 to 2026, and the 2025 and 2026 CPI values are estimates. The bucket edges and the P/E cut are choices, and I do not attach a confidence interval to any single number.
- Offer-implied earnings. I compute the P/E from the last reported annual earnings before the IPO, only where the filing and trading currency match. The 219 names without a usable earnings record drop out of the valuation cut.
What it means
Size decides whether an IPO pops, and price decides how the first year goes. Above about half a billion dollars at the offer the pop is flat near 13 percent, and below it the median IPO barely moves. Among the profitable IPOs, the return over the first year falls straight down the valuation ladder, from 13.0 percent at the cheapest to a loss at the priciest, while the loss-makers pop hard and then fall the most. So, there can be a case for grabbing an expensive IPO for the pop, as long as you sell quickly, while the cheap and profitable ones were the keepers over the first year. The takeaway is that a big pop is a sign of a large or expensive deal, and among IPOs that earn money the cheapest ones did the best over their first year.
Read next
- IPO boom = market top? The data says otherwise The other IPO study: whether a busy IPO year warns of weak market returns.
- Download Every US IPO from LSEG in Python The pipeline that built the IPO sample behind this post.
Disclaimer: a simplified, descriptive study for discussion purposes only. Not investment advice. Past performance does not predict future returns.
Data: US IPO offer prices, opening prints, market caps, and fundamentals from LSEG Workspace (licensed). I do not reproduce the raw file here.