Backtests tell you sweet little lies
Backtests tell you sweet little lies. A momentum strategy on Swedish stocks looked like it beat the market by a wide margin, until I charged it the costs a real trader pays. Jegadeesh and Titman (1993) find that stocks that rose over the past year tend to keep rising over the next few months. I test whether that held on Swedish stocks from 2001 to 2025, and what it cost to trade.
To separate the premium from the costs, I built three versions of the same portfolio. One ignores all costs. One subtracts the trading commission. One also subtracts the bid-ask spread.
The gross result was large. One krona in the momentum winners grew to 358 kronor before any costs. The same krona in an equal-weight index of the same stocks grew to 55. So, momentum beat the market by a wide margin on paper.
Then I add the costs a real trader pays, one layer at a time. A flat commission trimmed the ending pot from 358 to 321 kronor. The bid-ask spread cut it further, from 321 to 156. After both layers, one krona still grew to 156 against 55 for the market, so momentum kept its lead even though costs more than halved the ending pot.
The strategy
- Universe: Swedish common stocks, active and delisted, 2001 to 2025, with a market cap above 500 MSEK.
- Signal: 12-2 momentum, the past twelve months of return with the most recent month skipped.
- Portfolio: the top decile by that signal, equal weight, rebalanced monthly.
- Costs: a 0.069% commission per trade, then each traded stock’s bid-ask half-spread.
- Benchmark: an equal-weight index of the same eligible stocks.
I skip the most recent month because the very last month tends to reverse, so including it adds noise to the signal.
Starting point
The backtest runs off one price file of daily total returns, market caps, and bid-ask quotes for the Swedish market. Building it is a separate job that depends on the data vendor. I pull from LSEG Workspace. Because the data is licensed, the raw file stays off this page, and I show the code without running it here.
These ending values come from the run shown in the chart above. An earlier version of this backtest gave somewhat different momentum figures on the same idea. The market index and the conclusion do not change.
Step 1. The 12-2 momentum signal
Each stock gets one signal a month: its cumulative return over the past year, ending two months back. I work in log space so the twelve monthly returns add up, then convert back.
# Monthly total return per stock, moved into log space for clean compounding.
monthly["log1r"] = np.log1p(monthly["monthly_ret"])

# Rolling 12-month cumulative return, requiring a full year of history.
monthly["cum_12m"] = np.expm1(
    monthly.groupby("Instrument")["log1r"]
           .rolling(12, min_periods=12).sum()
           .reset_index(level=0, drop=True)
)

# Lag by one month so the signal at month t stops at the end of month t-2.
monthly["mom_signal"] = monthly.groupby("Instrument")["cum_12m"].shift(1)
The lag is what makes the signal “12-2”. The shift(1) moves each stock’s own past value forward so the signal that ranks stocks at the start of a month uses only returns that had already happened. Lesson 20 covers the one-month shift.
Step 2. Pick the top decile each month
I rank the eligible stocks each month and keep the highest tenth. The benchmark is the equal-weight return of every eligible stock that same month.
# Percentile rank within each month; 1.0 is the strongest momentum.
monthly["mom_rank"] = monthly.groupby("YM")["mom_signal"].rank(pct=True)

# The momentum winners: the top decile.
winners = monthly[monthly["mom_rank"] >= 0.9]

# The benchmark: equal-weight return of all eligible stocks that month.
market = monthly.groupby("YM")["monthly_ret"].mean()
Step 3. Layer the costs
I walk month by month and compare the winners this month with the winners last month. A name that stays in the book pays nothing. A name that enters or leaves pays the commission and half its bid-ask spread. I weight the spread cost by how much of the book trades.
COMMISSION = 0.00069                          # 0.069% per trade

for ym in months:
    held     = set(winners_this_month)
    entering = held - prev                    # names bought this month
    exiting  = prev - held                    # names sold this month

    # Spread: half the bid-ask spread on each traded name, weighted by portfolio share.
    spread_cost = (w_in * half_spread(entering)
                   + w_out * half_spread(exiting))

    # Commission: flat rate on every buy and every sell.
    comm_cost = (len(entering) + len(exiting)) / n * COMMISSION

    ret_no_cost = gross_ret                    # raw equal-weight return of the winners
    ret_comm    = gross_ret - comm_cost        # after commission
    ret_all     = gross_ret - comm_cost - spread_cost   # after commission and spread
    prev = held
I charge the spread on turnover, and a monthly top-decile rebalance turns over a large share of the book every month. That is why the 0.069% commission barely shows while the spread cuts the ending pot roughly in half. Lesson 31 covers how I measure and charge turnover.
Step 4. Compare to the market
I compound one krona through each of the four return streams and read off the ending value.
for label, col in [("No costs", "ret_no_cost"),
                   ("After commission", "ret_comm"),
                   ("After commission + spread", "ret_all"),
                   ("Market index", "market_ret")]:
    final = (1 + port[col]).cumprod().iloc[-1]     # one krona compounded to the end
    print(f"{label:<28} {final:.0f}")
No costs 358
After commission 321
After commission + spread 156
Market index 55One krona in the winners grew to 358 kronor with no costs, against 55 for the market index. The commission took it to 321. The bid-ask spread took it to 156. So, the commission removed a small slice and the spread removed the larger one, and after both the momentum book still ended at 156 kronor against 55 for the market.
Results
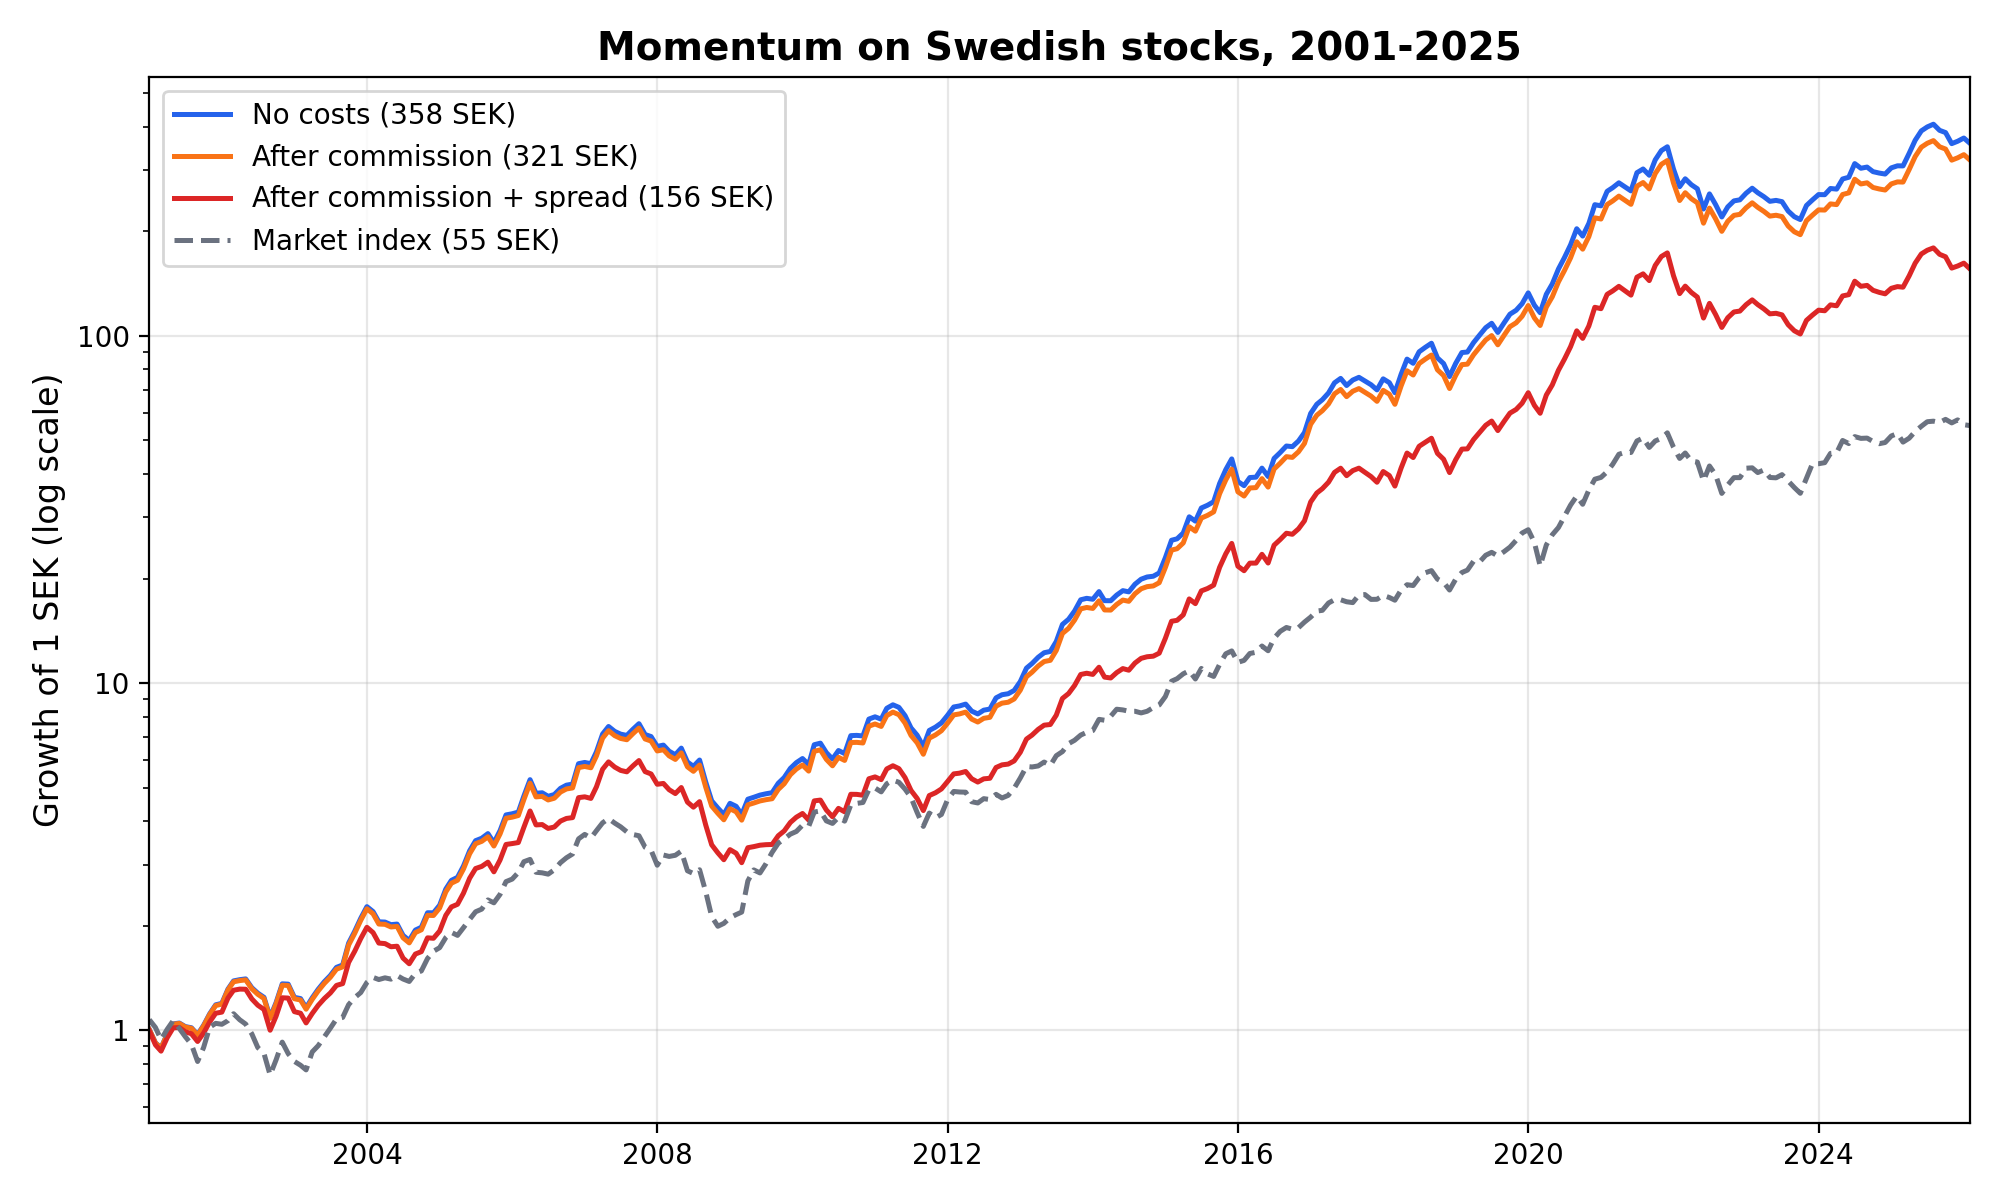
The three momentum lines sit close together until the mid-2010s, then the spread line pulls away from the other two as turnover accumulates. All three stay above the market index for the whole sample. The gross line and the after-cost line point the same way. The after-cost line ends far lower.
What this test does not settle
Turnover is the cost. A monthly top-decile rebalance replaces much of the book each month and pays the spread again and again. The 358-to-156 drop is mostly this repeated spread, and a slower rebalance would keep more of the gross return.
The spread is a median estimate. I use each stock’s median bid-ask spread and charge half of it. Real fills are worse than the quoted midpoint in small and thin names, which momentum holds plenty of, so the true drag is higher than the number here.
No market impact. I model the spread and the commission and stop there, following Novy-Marx and Velikov (2016). A large order pushes the price as it fills, and that impact would lower the after-cost line further.
One specification. Top decile, monthly rebalance, equal weight, a 500 MSEK floor, and winsorized monthly returns are all choices. Other reasonable choices give different numbers. This is one path, and it does not come with a confidence interval.
What it means
Momentum in Sweden earned a large lead over the market before costs, and most of that lead went to turnover the strategy has to pay for. The commission was almost free. The bid-ask spread more than halved the ending pot. After both, the winners still finished well ahead of the market index. Transaction costs are not the only thing that can break a backtest. Overfitting, survivorship bias, and data snooping do the same, but costs are the easiest to measure and the hardest to argue away. The takeaway is that momentum survived realistic trading costs in this sample, and the commission barely matters while the bid-ask spread decides how much of the gross premium a trader keeps.
Read next
- The Magic Formula worked. Just not lately. Another published edge on US stocks, and what happened to it once everyone could run it.
- Does your backtested Sharpe ratio show a real edge? One of the other things that inflate a backtest: too few observations behind a Sharpe ratio.
Disclaimer: simplified, hypothetical backtest with approximate trading costs, for discussion purposes only. Not investment advice. Past performance does not predict future returns.
Data: Swedish equity daily total returns, market caps, and bid-ask quotes from LSEG Workspace (licensed). I do not reproduce the raw file here.