Currency risk matters, especially if you are Swedish or Swiss
The same S&P 500 total return, held from 1988 to 2026 with dividends reinvested, grew at 13.0% a year for a Swedish investor and at 10.1% a year for a Swiss one. Over 38.5 years, one unit grew to 109.7 times its size for the Swedish investor and 41.1 times for the Swiss investor. The dollar investor’s final multiple is 65.4 times. The six investors held the identical asset, so the exchange rate alone makes the largest final multiple 2.7 times the smallest, each counted in its own currency before inflation.
I test whether the currency you count in changes the outcome of a single buy-and-hold investment. I take one series, the S&P 500 total return index, and convert its daily value into six home currencies without hedging, that is without protection against exchange-rate moves: the US dollar, the euro, the yen, the pound, the Swiss franc, and the Swedish krona.
What you end up with
- One index. The S&P 500 total return, daily, dividends reinvested, from January 1988.
- Five exchange rates. Daily spot rates, the rates for exchanging currency now, against the dollar for the euro, yen, pound, franc, and krona.
- Six rebased curves. The value of one unit in each home currency, each starting at exactly 1.0.
- A risk table. Final multiple, annual return, annual volatility (how much returns swing), and worst drawdown (the largest fall from a previous peak) for each currency.
Starting point
The conversion uses one price file, the index in dollars and one daily spot rate for each currency, which I download from LSEG Workspace in a separate job. Because the data is licensed, the raw file stays off this page, and the code below is shown without being run on this page. The index is the total return series, .SPXTR, which reinvests dividends gross of withholding tax. The official series starts on 4 January 1988, so the sample begins after the October 1987 crash.
Step 1. One asset, six currencies
Each currency needs one exchange rate and a rule for which way to apply it.
# One asset: the S&P 500 total return index, dividends reinvested, daily from 1988.
SPX_RIC = ".SPXTR"                          # LSEG code for the total return index

# One entry per exchange rate, keyed by its LSEG code. Each entry records the column
# name for the rate, the home currency it belongs to, and which way the pair is
# quoted. Naming the three fields means the conversion below can ask for the one it
# wants instead of counting positions in a tuple.
# The euro rate before 1999 is LSEG's synthetic ECU basket, because the euro did not exist.
FX_PAIRS = {
    "EUR=": {"column": "EURUSD", "currency": "EUR", "usd_per_home_unit": True},
    "JPY=": {"column": "USDJPY", "currency": "JPY", "usd_per_home_unit": False},
    "GBP=": {"column": "GBPUSD", "currency": "GBP", "usd_per_home_unit": True},
    "CHF=": {"column": "USDCHF", "currency": "CHF", "usd_per_home_unit": False},
    "SEK=": {"column": "USDSEK", "currency": "SEK", "usd_per_home_unit": False},
}
The index is a dollar asset, so its value in kronor is the index times the number of kronor per dollar. The euro and pound rates are quoted as dollars per home unit, so the euro and pound values divide the index by the rate instead. The usd_per_home_unit flag records which way each pair is quoted.
Step 2. Convert and rebase
Each day I take the index level in dollars and convert it at that day’s spot rate. Then I rebase every curve to 1.0 at the first common date, so each line reads as the growth of one unit in that currency.
# The index sets the calendar: its dates are the US trading days.
panel = pd.DataFrame({"spxtr": spx})

# Each rate arrives as its own series on its own calendar. reindex moves a rate onto the
# index dates, and ffill copies the last quote forward over a foreign holiday. The limit
# of five days stops a long gap from being filled with a badly stale rate.
for column, rate_series in fx.items():
    panel[column] = rate_series.reindex(panel.index).ffill(limit=5)

# Keep only the dates where the index and every one of the five rates exist
panel = panel.dropna()

home = pd.DataFrame(index=panel.index)
home["USD"] = panel["spxtr"]                 # the US investor holds the raw index

# A pair quoted as dollars per home unit is divided out to convert to the home currency, and a
# pair quoted as home units per dollar is multiplied in.
for pair in FX_PAIRS.values():
    currency = pair["currency"]
    rate = panel[pair["column"]]
    if pair["usd_per_home_unit"]:
        home[currency] = panel["spxtr"] / rate
    else:
        home[currency] = panel["spxtr"] * rate

# Dividing every row by the first row starts all six curves at exactly 1.0 on the same
# day, which is what makes them comparable as the growth of one unit.
rebased = home / home.iloc[0]

final_values = rebased.iloc[-1]              # the last row: one value per currency
final_multiples = {}
for currency, value in final_values.items():
    final_multiples[currency] = round(value, 1)
print("final multiples:", final_multiples)
final multiples: {'USD': 65.4, 'EUR': 74.6, 'JPY': 86.3, 'GBP': 92.3, 'CHF': 41.1, 'SEK': 109.7}The dropna keeps only the dates where the index and all five rates exist together, and the earliest of those is 4 January 1988, the first date of the index itself. From there the six curves start at the same 1.0 and separate only through the exchange rate.
Step 3. The final multiples and the risk table
For each currency I report the final multiple, the annualised return, the annual volatility, and the deepest drawdown from that curve’s own running peak.
# The length of the sample, used to annualise the return here and the currency drift
# below. 365.25 rather than 365 accounts for the leap days across four decades.
sample_days = (rebased.index[-1] - rebased.index[0]).days
years = sample_days / 365.25

daily_returns = rebased.pct_change().dropna()   # the first day has no day before it

# cummax is the running maximum, so this is the fall from the highest point reached so
# far. It is zero on a new high and negative in between.
drawdown = rebased / rebased.cummax() - 1

# The steady yearly rate that would turn 1.0 into the final multiple over the sample
annual_return = final_values ** (1 / years) - 1

# Daily variation scaled up to a year. 252 is the usual count of US trading days.
annual_volatility = daily_returns.std() * np.sqrt(252)
max_drawdown = drawdown.min()                   # the deepest single fall per currency


# The table holds text, so each column is turned into strings by one small function.
def as_multiple(value):
    """Format a growth multiple: 65.43 -> '65.4x'."""
    return f"{value:,.1f}x"


def as_percent(value):
    """Format a decimal rate as a percentage: 0.1153 -> '11.5%'."""
    return f"{value * 100:.1f}%"


def as_whole_percent(value):
    """Format a decimal rate as a whole percentage: -0.5462 -> '-55%'."""
    return f"{value * 100:.0f}%"


# Rank the currencies from the largest final multiple down, so the table reads best first
currencies_by_multiple = final_values.sort_values(ascending=False).index

# map applies a function to every value of a series, one currency at a time
summary = pd.DataFrame({
    "Final multiple":  final_values.map(as_multiple),
    "CAGR":            annual_return.map(as_percent),
    "Volatility p.a.": annual_volatility.map(as_percent),
    "Max drawdown":    max_drawdown.map(as_whole_percent),
}).loc[currencies_by_multiple]

first_date = rebased.index[0].date()
last_date = rebased.index[-1].date()
print(f"S&P 500 total return, {first_date} -> {last_date} ({years:.1f} years), unhedged")
print(summary.to_string())
S&P 500 total return, 1988-01-04 -> 2026-07-01 (38.5 years), unhedged
Final multiple CAGR Volatility p.a. Max drawdown
SEK 109.7x 13.0% 19.1% -52%
GBP 92.3x 12.5% 19.2% -52%
JPY 86.3x 12.3% 22.5% -63%
EUR 74.6x 11.9% 19.9% -64%
USD 65.4x 11.5% 17.9% -55%
CHF 41.1x 10.1% 21.8% -66%The annual return ranges from 13.0% for the krona down to 10.1% for the franc, with the dollar at 11.5% in between. That is a difference of almost 3 percentage points a year on the same asset. Compounded over 38.5 years, those annual returns give final multiples of 109.7 times and 41.1 times.
To see where the difference comes from, I measure the annual drift of each exchange rate over the sample.
# Collect the rate columns in the order the pairs were listed in Step 1, so the lines
# print in that order too.
fx_columns = []
for pair in FX_PAIRS.values():
    fx_columns.append(pair["column"])

fx_rates = panel[fx_columns]                 # the raw rates, on the dates the panel kept
first_rates = fx_rates.iloc[0]               # each rate on the first day of the sample
last_rates = fx_rates.iloc[-1]               # each rate on the last day

# The same annualising as the equity return, applied to the rate itself. Read the sign
# against the quoting convention above: USDSEK rising means more kronor per dollar, while
# GBPUSD falling means fewer dollars per pound.
fx_drift = (last_rates / first_rates) ** (1 / years) - 1

for column in fx_columns:
    print(f"{column}: {fx_drift[column] * 100:+.2f}% p.a.")
EURUSD: -0.34% p.a.
USDJPY: +0.72% p.a.
GBPUSD: -0.89% p.a.
USDCHF: -1.20% p.a.
USDSEK: +1.35% p.a.The number of kronor per dollar increased by 1.35% a year, so the krona weakened against the dollar, and a Swedish investor earned the dollar return of the index and the currency gain on top. The franc strengthened against the dollar at 1.2% a year, so a Swiss investor earned the same index return reduced by that currency loss. So the annual returns follow the order of each home currency’s change against the dollar: the currency that fell the most produced the highest multiple, and the one currency that rose produced the lowest.
Results
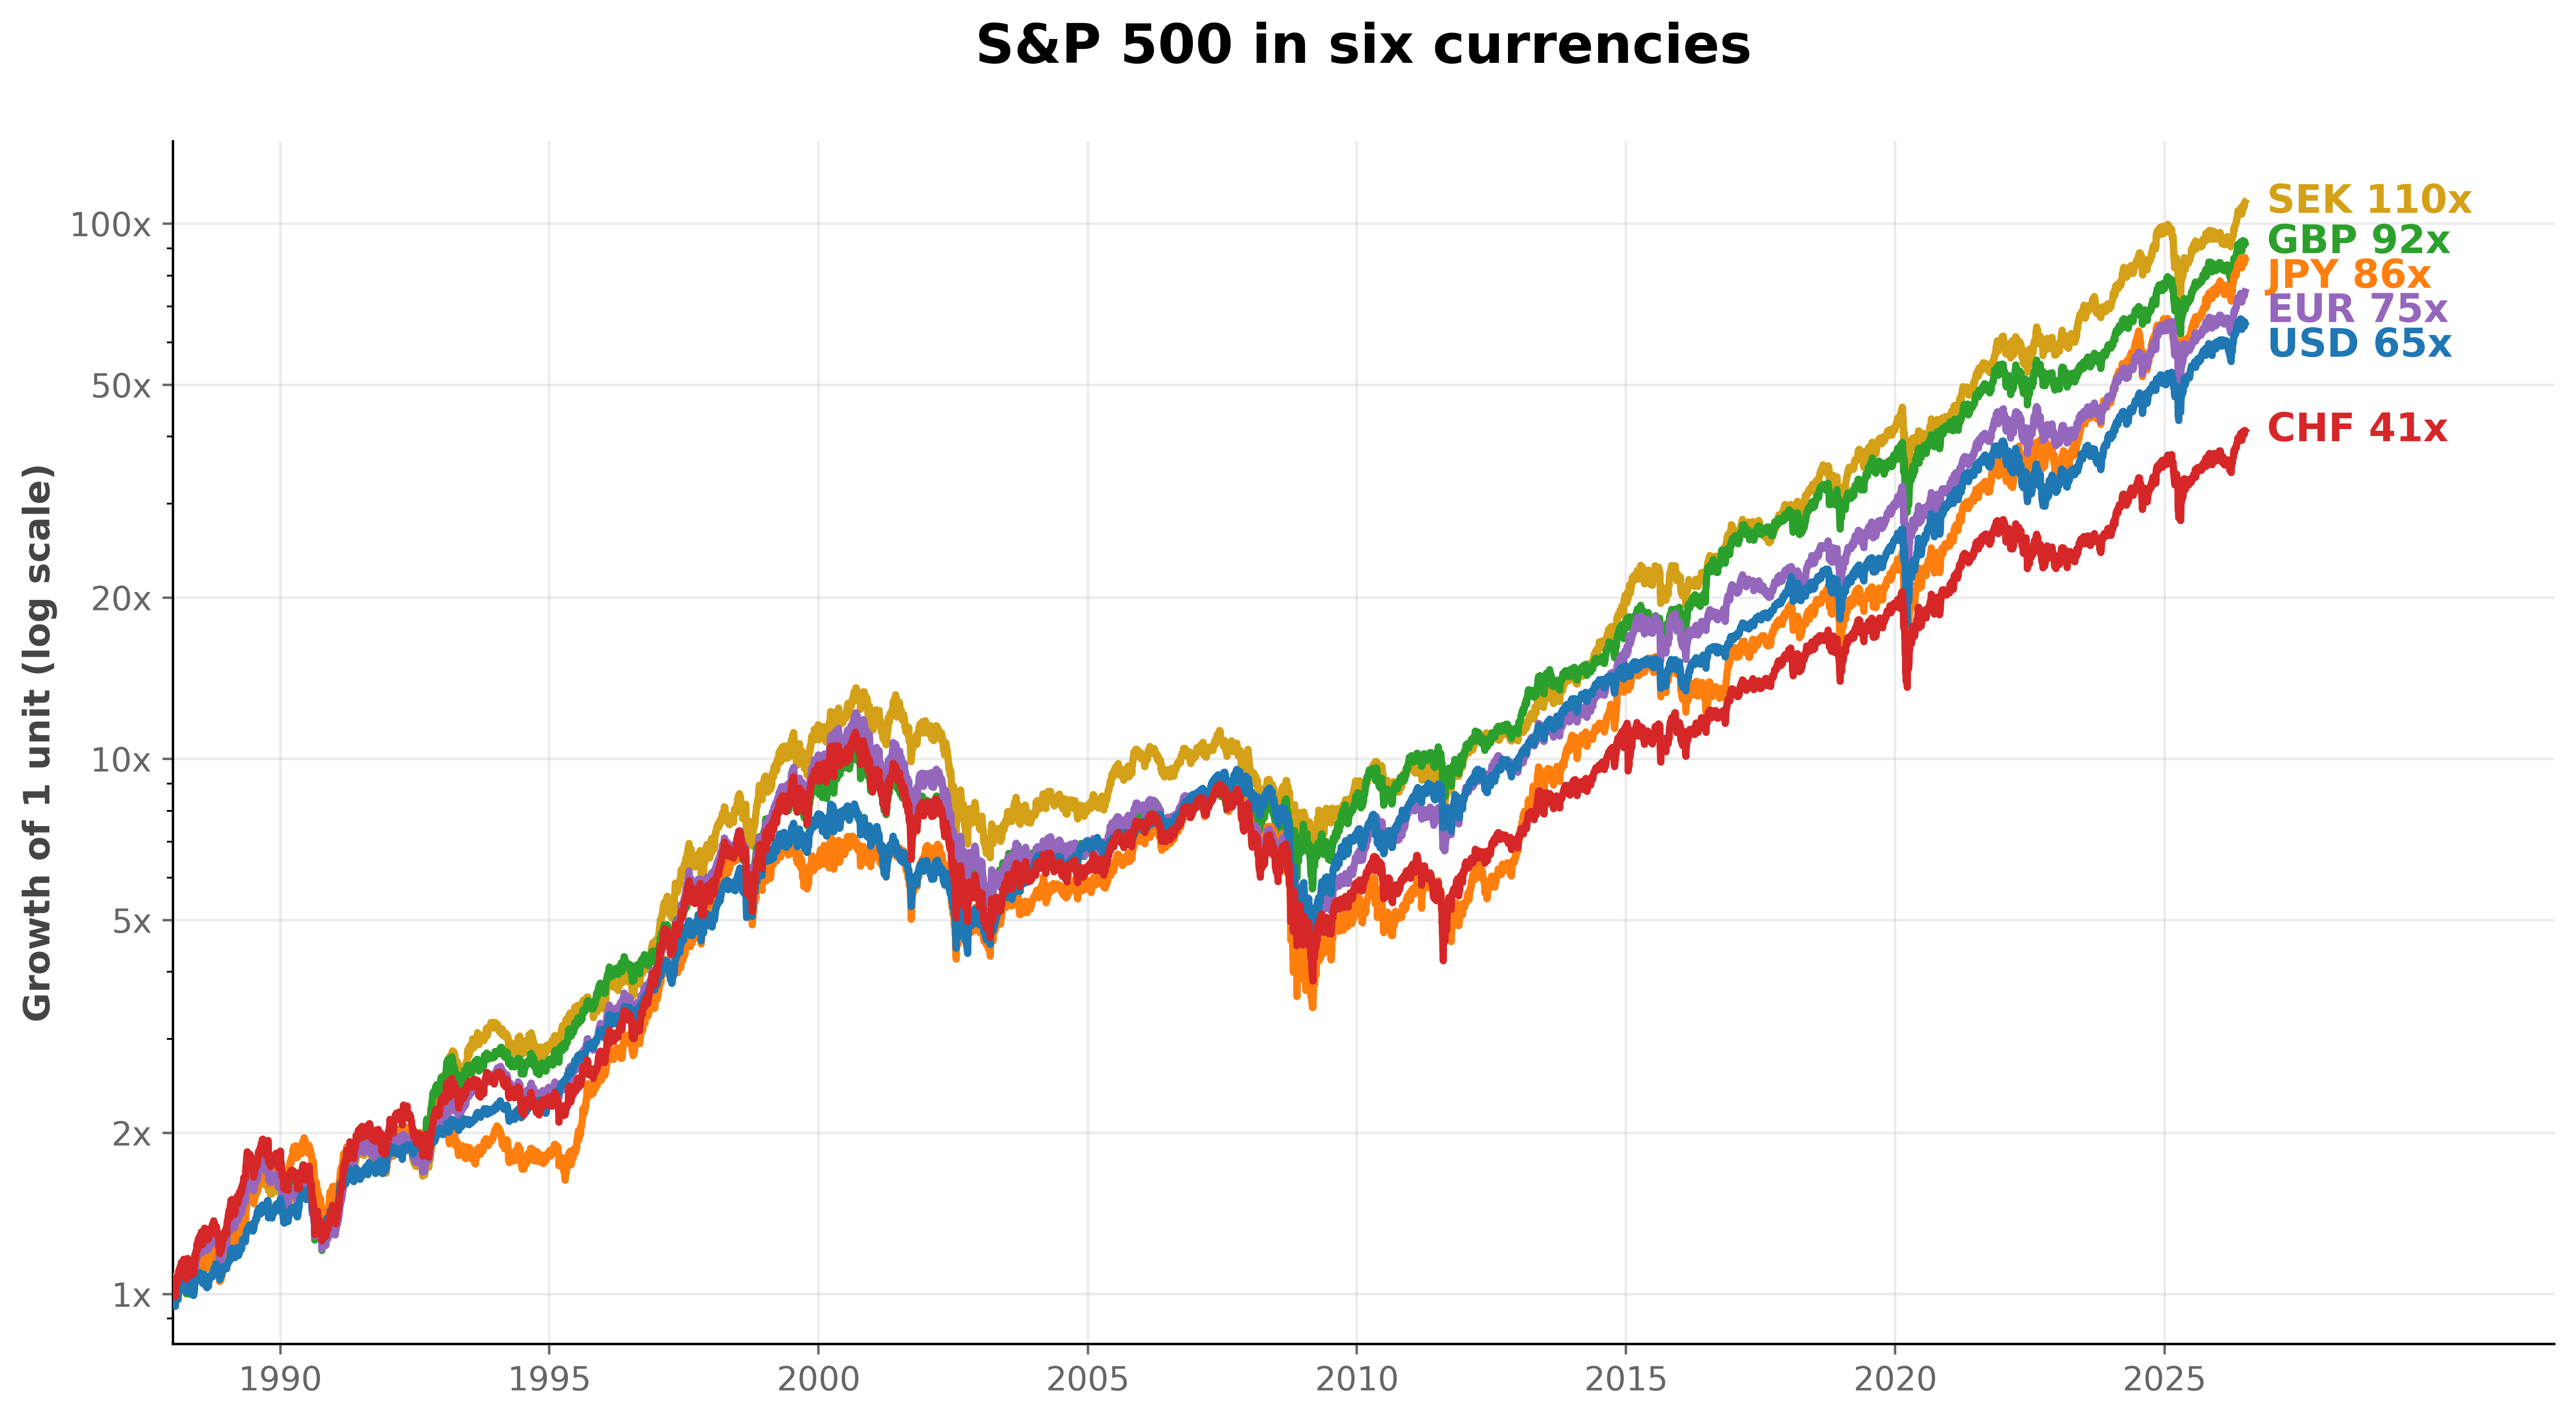
The six lines start at 1.0 in 1988 and end in that same order. The yen and franc lines were also the most volatile in local terms, at 22.5% and 21.8% a year, against 17.9% for the dollar, because the exchange rate adds its own variation to the variation of the index. Every investor lived through the same equity crashes, and the depth of the drawdown differs by currency. The Swiss investor’s drawdown was the deepest of the six at 66 percent. The dollar investor’s was 55 percent.
Limitations
The pre-1999 euro is synthetic. The euro did not exist before January 1999, so the early euro line uses LSEG’s ECU-based basket history. Treat the first eleven years of the euro curve, and so the euro multiple, as an approximation.
Unhedged, and free of costs and taxes. The conversion applies the spot exchange rate with no hedge, no transaction costs, and no withholding on dividends. I do not test a hedged version. A hedge has gains and losses of its own, so the gaps between the six curves do not show what hedging would have added or removed.
Before inflation. Inflation differed across the six currencies, and I do not adjust for it. A higher multiple in kronor than in francs therefore does not show that the Swedish investor could buy more with the result than the Swiss investor.
One index, one span. The test covers the S&P 500 over one mostly rising period and one set of exchange-rate paths. I do not test other currencies or other spans. This is one history, and I do not attach a confidence interval, a range that likely contains the true value, to the ranking.
Drawdowns are in local currency. I measure each drawdown from that curve’s own peak in its own currency, so the same crash reads as a different depth per investor. That is the comparison I intend here, and a local-currency drawdown is not comparable to a single dollar drawdown.
Conclusion
The same investment, over the same 38.5 years, ranged from 41.1 times to 109.7 times depending only on the currency the investor counted in. The index return in dollars was identical for all six. The difference is the exchange rate compounding alongside the index. Over this sample, the change in the exchange rate raised the annual return in the home currency above the dollar return for the four investors whose currency fell against the dollar, and lowered it for the Swiss investor, whose currency rose. The takeaway is that the return we earn on a foreign asset held without a hedge is the asset and the currency together, because the exchange rate compounds over decades just as the price does.
Read next
- Buy the dip? US vs. Europe Another cross-market comparison, this time on when a falling stock is worth buying.
- The Magic Formula worked. Just not lately. A US strategy measured against the S&P 500.
Disclaimer: This is a simplified, hypothetical calculation for discussion purposes only. Not investment advice. Past performance does not guarantee future returns.
Data: S&P 500 total return index (.SPXTR) and daily spot FX from LSEG Workspace (licensed). I do not reproduce the raw file here.