How persistent is a firm’s cost of capital relative to other firms?
When I learned the discounted cash flow (DCF) model as an undergraduate, I was taught to compute a discount rate, the rate that converts future cash into today’s money, once and apply it to every year of projected cash flows. That treats the rate as constant, even though its components all move over time. Bali, Engle and Murray (2016) measure persistence as the correlation across firms between a firm’s characteristic at one date and its value some months later, averaged over every starting date. A correlation is a number between −1 and 1 that measures how closely two sets of values move together. I measure that persistence for the weighted average cost of capital (WACC) and for its two main components, the cost of equity, the return shareholders require, and the cost of debt, the interest rate the firm pays on its borrowing, across US firms.
Persistence is moderate at one year and weak at five. Across firms, WACC correlates 0.7 with its value one year later. At five years the correlation is 0.2. Cost of debt is the most persistent of the three at five years, and cost of equity decays the most between one year and five.
A correlation near one means that firms with a high value relative to other firms today still have a high value relative to other firms later. A correlation near zero means that a firm’s position today says little about its position later. The correlation does not measure whether the level of WACC stays the same: if every firm’s WACC increased by ten percentage points, the correlation would still be one.
The variables
- WACC: the blended cost of capital LSEG StarMine reports for each firm, with equity and debt weighted by their share of the capital structure.
- Cost of equity: the equity component, from a capital asset pricing model (CAPM) style estimate, which depends on the stock’s beta, how strongly its returns vary with the market’s.
- Cost of debt: the after-tax cost of debt component.
Starting point
The analysis uses one long-format panel of month-end WACC values, built from the StarMine cost-of-capital fields that I download from LSEG Workspace in a separate job. Because the data is licensed, I cannot share the raw file, and the code below is shown without being run on this page. The panel has 125 month-end dates, from December 2015 to April 2026, with a median of 3,753 US firms a month, the middle value across the months, and 6,076 firm identifiers over the whole period.
Step 1. Persistence
For each lag I take the cross-section of a variable at month t, its values across firms, and the cross-section at month t + tau, and keep the firms present in both. I cap each cross-section at its 0.5% and 99.5% quantiles, the values that 0.5% and 99.5% of the firms are below, which is called winsorising and limits outliers, and correlate the two. Then I average that correlation over every starting month. I do this at lags of 12, 24, 36, 48, and 60 months, which are one through five years.
PERSIST_LAGS = [12, 24, 36, 48, 60]   # lags in months: 1 to 5 years
WINS_Q = 0.005                        # winsorise each tail at 0.5%
MIN_FIRMS = 30                        # skip a pair of dates sharing fewer firms than this


def winsorise(values, tail=WINS_Q):
    """Cap the most extreme values rather than remove them."""
    # The two cutoffs are read off the values handed in, so every cross-section is capped
    # on its own scale. clip() then sets any value past a cutoff to that cutoff, which keeps
    # every firm in the sample and limits how far one extreme value moves the correlation.
    low_cutoff = values.quantile(tail)
    high_cutoff = values.quantile(1 - tail)
    return values.clip(low_cutoff, high_cutoff)


def persistence(panel, lags=PERSIST_LAGS):
    """Average cross-sectional correlation of a variable at t and t+tau."""
    month_ends = panel.index
    average_by_lag = {}

    for tau in lags:
        correlations = []

        # Each starting month gives one correlation, so the loop walks the panel from the
        # first row to the last one that still has a partner tau rows below it. iloc reads
        # a row by its position rather than by its date label.
        for start in range(len(month_ends) - tau):
            today = panel.iloc[start].dropna()          # the cross-section at t
            later = panel.iloc[start + tau].dropna()    # the cross-section at t+tau

            # A correlation needs both ends of every pair, so only the firms with a value
            # on both dates count. intersection() gives the labels the two share.
            firms_on_both_dates = today.index.intersection(later.index)
            if len(firms_on_both_dates) < MIN_FIRMS:    # too few pairs for a correlation
                continue

            today_capped = winsorise(today[firms_on_both_dates])
            later_capped = winsorise(later[firms_on_both_dates])

            # corr() is the Pearson correlation across firms for this one pair of dates
            correlations.append(today_capped.corr(later_capped))

        average_by_lag[tau] = np.mean(correlations)     # average over the months that qualified

    return average_by_lag
Winsorising limits the effect of a handful of extreme values, such as a bankruptcy-driven cost of equity, without dropping any firm.
Step 2. The persistence table
I run the same measure on each of the three variables and collect one row each. Each column is the average correlation at that horizon.
FIELDS = {
    'TR.WACC': 'WACC',
    'TR.WACCCostofEquity': 'Cost of Equity',
    'TR.WACCCostofDebt': 'Cost of Debt',
}

rows = []
for field, name in FIELDS.items():
    variable_rows = long_df[long_df['field'] == field]      # one variable at a time

    # pivot_table turns the long table into a wide one, with a row per date and a column
    # per firm, which is the shape a cross-section is read from.
    wide_panel = variable_rows.pivot_table(index='date', columns='ric', values='value')

    # persistence() steps through the rows by position, so the dates have to be in order
    panel_in_date_order = wide_panel.sort_index()

    # resample('ME') lays the dates on one month-end grid and last() takes the final
    # observation inside each month, so a gap of tau rows is always tau calendar months.
    month_end_panel = panel_in_date_order.resample('ME').last()

    average_by_lag = persistence(month_end_panel)           # {tau: average correlation}

    # One row of the table, with the lags in months turned into column names in years
    row = {'variable': name}
    for tau in PERSIST_LAGS:
        row[f'{tau // 12}y'] = average_by_lag[tau]          # 12 months becomes '1y'
    rows.append(row)

table = pd.DataFrame(rows).set_index('variable')
print(table.round(3).to_string())
1y 2y 3y 4y 5y
variable
WACC 0.668 0.523 0.403 0.305 0.229
Cost of Equity 0.774 0.630 0.490 0.363 0.249
Cost of Debt 0.644 0.534 0.467 0.438 0.403Across firms, WACC correlates 0.7 with its value one year later. At two years the correlation is 0.5, at three years 0.4, and by five years 0.2. So, a firm with a high WACC relative to other firms today has only a weak tendency to have a high WACC relative to other firms five years later.
Cost of equity is the most persistent of the three at one year, at 0.8, and decreases the most, to 0.2 at five years.
Cost of debt is the least persistent of the three at one year, at 0.6, and decays more slowly than WACC and cost of equity. At five years it is still 0.4, the highest of the three at that horizon.
Results
RED, TEAL, ORANGE = '#C0392B', '#17868A', '#D2822B'
# The site's chart colours: a cream background, a light grid and a pale frame, so every chart
# on the site has the same look.
BG, INK, GRID, SPINE, AXIS_TEXT = '#FCEFE3', '#1f1f1f', '#EADCCC', '#D5C6B4', '#4a4a4a'
LINE_COLOUR = {'WACC': RED, 'Cost of Equity': TEAL, 'Cost of Debt': ORANGE}


def style_chart(figure, axis):
    """Give a finished chart the site's cream background, light grid and pale frame."""
    figure.patch.set_facecolor(BG)
    axis.set_facecolor(BG)
    axis.grid(True, axis='y', color=GRID, lw=1.0)
    axis.set_axisbelow(True)
    for side in ('top', 'right'):
        axis.spines[side].set_visible(False)
    for side in ('left', 'bottom'):
        axis.spines[side].set_color(SPINE)
    axis.tick_params(axis='both', length=0, colors=INK, pad=6)
    axis.xaxis.label.set_color(AXIS_TEXT)
    axis.yaxis.label.set_color(AXIS_TEXT)
    axis.title.set_color(INK)
    # Each legend entry in the colour of the line it labels.
    # get_legend() returns None when the chart has no legend.
    legend = axis.get_legend()
    if legend is not None:
        for text, handle in zip(legend.get_texts(), legend.legend_handles):
            text.set_color(handle.get_color())


# The horizons on the x axis are the same five lags as the table columns, read in years,
# so one list drives both the plotted points and the tick marks.
YEARS_AHEAD = [tau // 12 for tau in PERSIST_LAGS]

fig, ax = plt.subplots(figsize=(10, 6))

for name in table.index:                          # one line per variable
    correlations = table.loc[name]                # that variable's five numbers, 1y to 5y
    ax.plot(YEARS_AHEAD, correlations, marker='o', lw=2, color=LINE_COLOUR[name], label=name)

ax.set_xlabel('Years ahead')
ax.set_ylabel('Correlation with today')
ax.set_title('How persistent is cost of capital relative to other firms?')
ax.set_ylim(0, 1)
ax.set_xticks(YEARS_AHEAD)
ax.legend(loc='lower left', frameon=False)
style_chart(fig, ax)
plt.tight_layout()
plt.savefig('wacc_persistence_decay.png', dpi=150, facecolor=BG)
plt.show()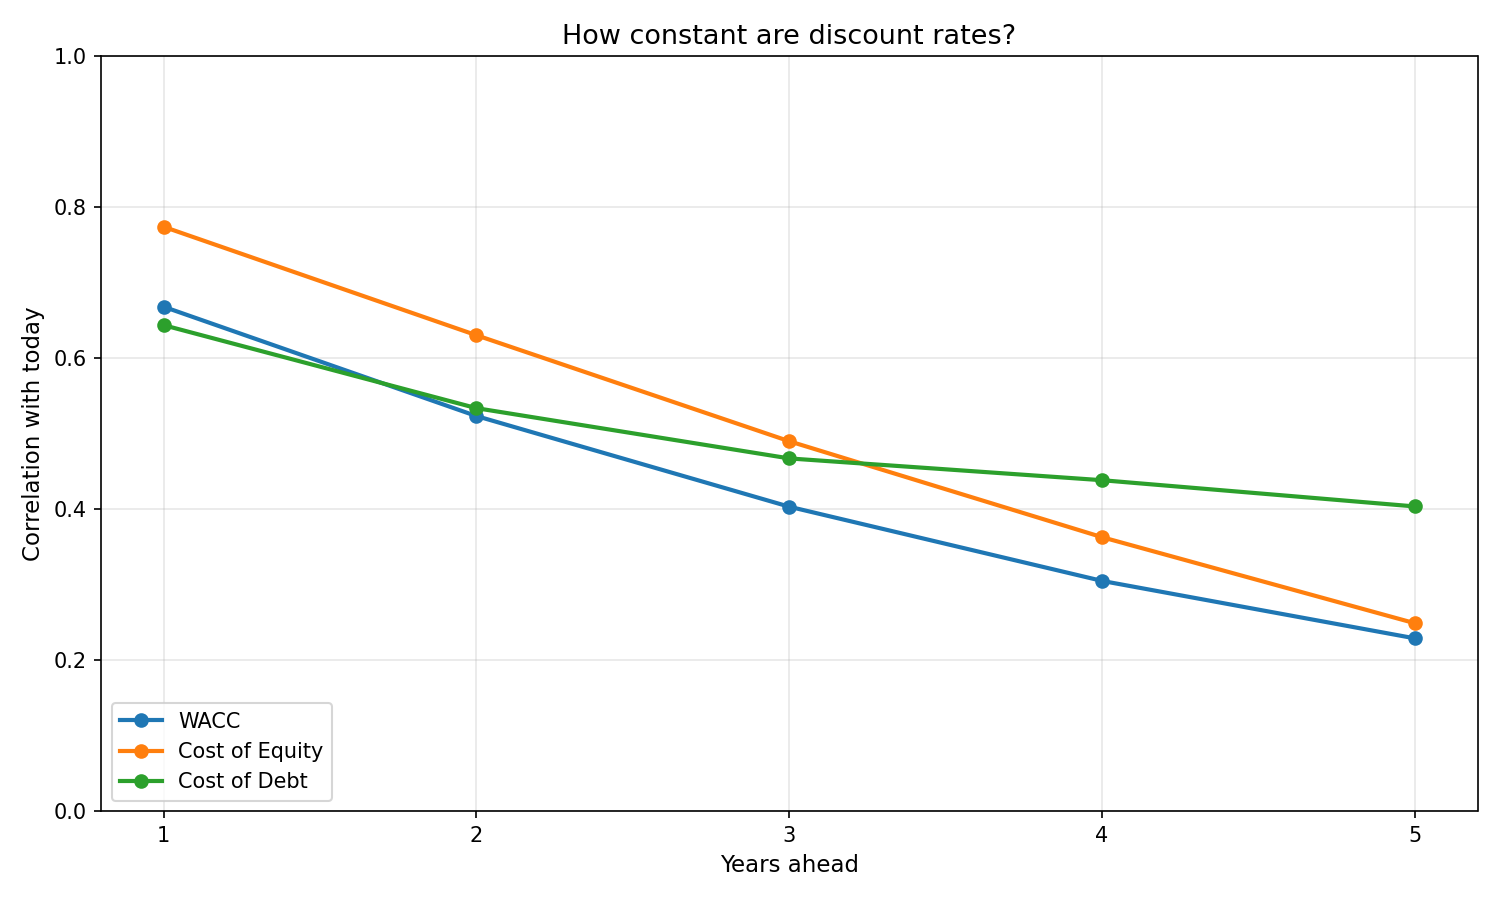
The chart plots the table: all three average correlations decrease at every longer horizon, and the cost-of-debt line is the flattest.
Limitations
Mechanical overlap. If LSEG estimates the beta inside WACC over a rolling window of past returns, two cross sections closer together than that window share some of the same return data, and that shared input tends to raise the correlation at the shorter lags. The longer the lag, the less of this overlap. I have not confirmed the window LSEG uses, and I do not measure how much the overlap adds to any column.
One vendor’s definition. The numbers describe LSEG’s WACC and its components. I use the vendor’s figures and do not compute a WACC myself. I do not test how a different beta window, tax rate, or capital-weight rule would change the levels or the persistence.
Overlapping windows. The correlation at each lag averages over every starting month, and windows one month apart share almost all of their firms. The 125 months are not 125 independent draws, so I do not attach a confidence interval, a range that likely contains the true value, to any figure.
A short panel. The sample is 125 months, from December 2015 to April 2026. The five-year correlation averages the 65 starting months that have a partner 60 months later, against 113 starting months at the one-year lag.
Three unusual months. The median WACC across firms is 1.6% in December 2021 and 0.9% in October 2023, against 6.4% to 8.0% at the other year-ends, and in October 2023 the cost of equity covers only 111 firms. April 2026 covers only 118 firms. Leaving out these three months changes no correlation in the table by more than 0.02: the one-year WACC figure becomes 0.686 in place of 0.668.
Conclusion
Across US firms, a firm’s current WACC relative to other firms is a fair guide to where it will be relative to other firms next year and a weak guide to where it will be five years out. Cost of debt is the most persistent of the three variables at long horizons, and WACC the least persistent. Because the correlations are below one, at least some firms’ WACCs change over time, so a single WACC applied across a multi-year DCF is a modelling convenience. I do not measure how much a single firm’s WACC changes in percentage points, which is the quantity a multi-year DCF needs. The takeaway is that a firm’s cost of capital relative to other firms is moderately persistent at one year and weakly persistent at five.
Read next
- The Magic Formula worked. Just not lately. Cheapness and return on capital, the characteristics a discount rate is meant to price.
- The most profitable US companies beat the S&P 500, and the least profitable lost money Profitability and quality, measured the same point-in-time way.
Disclaimer: this is a descriptive statistical analysis for discussion purposes only. Not investment advice.
Data: WACC and its components for US firms from LSEG StarMine, accessed through Workspace (licensed). I do not reproduce the raw file here. Method: Turan G. Bali, Robert F. Engle and Scott Murray, Empirical Asset Pricing: The Cross Section of Stock Returns, 2016.