The Magic Formula worked. Just not lately.
The Magic Formula worked. Just not lately. Joel Greenblatt introduced it in The Little Book That Beats the Market, a mechanical rule that ranks stocks on two numbers: earnings yield (how cheap the business is) and return on capital (how good it is). Buy the top of that ranking, hold each pick for a year, and Greenblatt (2006) argues you beat the market.
I test whether that held on US stocks from 2001 to 2026. Over the full 25 years it did. The Magic Formula returned 11.1% a year. The S&P 500 returned 8.7%. A dollar grew to 13.9 times its size. The same dollar in the index grew to 8.0 times.
The edge is concentrated in time. The Magic Formula beat the S&P through about 2015, then trailed it. Over the last five years it is behind by 6.6 percentage points a year. That is the pattern behind the Wall Street Journal piece on the formula that stopped working.
The strategy
- Universe: US common stocks, 2001 to 2026, active and delisted. I exclude financials and utilities, as Greenblatt prescribes, and keep the largest 3,500 names each month with a market cap above $200m.
- Signal: rank each stock on earnings yield (EBIT over enterprise value) and on return on capital, then add the two ranks. A low combined score is a cheap, high-quality business.
- Portfolio: the top 30, bought three fresh names a month and each tranche held for twelve months, so the book turns over once a year. Equal weight.
- Costs: the bid-ask half-spread on each traded name plus a 0.05% commission.
- Benchmark: the S&P 500 total return.
I score on the ranks each month, because a single stock with a tiny enterprise value can post an earnings yield of several hundred percent and swamp a level-based score. Ranking each stock against the others each month keeps the two pieces on the same scale.
Starting point
The backtest runs off one price-and-fundamentals file. Building it is a separate job that depends on the data vendor. I pull from LSEG Workspace. Because the data is licensed, the raw file stays off this page, and I show the code without running it here. The download route is the one from an earlier post, with the universe set to US common stocks and the fundamental fields added.
Step 1. The Magic Formula score
Each month I rank the eligible stocks on the two pieces and add the ranks.
# Earnings yield and return on capital, point-in-time (previous month's fundamentals).
me["EY"] = me["EBIT"] / me["EV"]                      # operating earnings over enterprise value

# Keep only valid signals: positive EBIT, EV above zero, positive return on capital.
me = me[(me["EBIT"] > 0) & (me["EV"] > 0) & (me["ROC"] > 0)]

# Cross-sectional ranks each month: rank 1 is the cheapest, and the highest return on capital.
me["rank_EY"]  = me.groupby("month")["EY"].rank(ascending=False, method="first")
me["rank_ROC"] = me.groupby("month")["ROC"].rank(ascending=False, method="first")

# The combined score. A low score is cheap and high quality at once.
me["score"] = me["rank_EY"] + me["rank_ROC"]
I cap the earnings yield at 50% and the return on capital at 200% before ranking. A yield above half of enterprise value almost always means stale trailing earnings sitting under a crashed price.
Step 2. Greenblatt’s staggered book
Greenblatt does not rebalance the whole portfolio at once. Each month I buy the three best-scoring names not already held, and I sell each tranche twelve months later. At full capacity that is about 36 positions, equal weighted, with one tranche rolling out and one rolling in each month. I charge costs only on the names that trade.
N_PER_TRANCHE, HOLD_MONTHS = 3, 12

active = {}                                          # buy_month -> the three names bought that month
records = []

for m in months:                                     # walk month by month
    # Sell the tranche that is now twelve months old.
    active.pop(m - HOLD_MONTHS, None)
    held = {s for names in active.values() for s in names}

    # Buy the three best-scoring names not already held.
    screen = mf_screen[m]                            # top 30 by score this month
    fresh  = [s for s in screen if s not in held][:N_PER_TRANCHE]
    active[m] = fresh

    # Cost: half-spread plus commission on every name sold or bought this month.
    traded = set(sold) | set(fresh)
    cost   = sum(get_hs(s, m) + COMMISSION for s in traded) / len(held | set(fresh))

    # Equal-weight daily return of the whole book, less the cost on the rebalance day.
    day_ret = daily.loc[daily.month == m, sorted(held | set(fresh))].mean(axis=1)
    records.append(day_ret.rename(index=lambda d: d) - cost)   # cost charged on day one
The staggering spreads the entry and exit dates across the year, so the result does not hinge on one lucky rebalance date. It also keeps turnover low, and so costs. Over the 25 years the strategy pays about 0.4% a year in trading costs.
The engine behind this is the one from Lesson 34 in Learn, and Lesson 31 covers how the turnover is charged.
Step 3. Compare to the S&P 500
def stats(daily_ret):
    nav  = (1 + daily_ret).cumprod()
    yrs  = len(daily_ret) / 252
    cagr = nav.iloc[-1] ** (1 / yrs) - 1                       # annualised return
    vol  = daily_ret.std() * np.sqrt(252)                     # annualised volatility
    sr   = cagr / vol                                         # Sharpe ratio
    return cagr, vol, sr, nav.iloc[-1]
Cumulative Annualized Sharpe Max drawdown
S&P 500 8.0x 8.7% 0.45 -54.7%
Magic Formula 30 13.9x 11.1% 0.44 -66.4%Over the full sample the Magic Formula returned 11.1% a year against 8.7% for the S&P. The extra return came with more risk: its worst drawdown was 66.4%, against 54.7% for the index, and the two Sharpe ratios are almost identical at 0.44 and 0.45. The formula earned more per year, and about the same per unit of risk.
Results
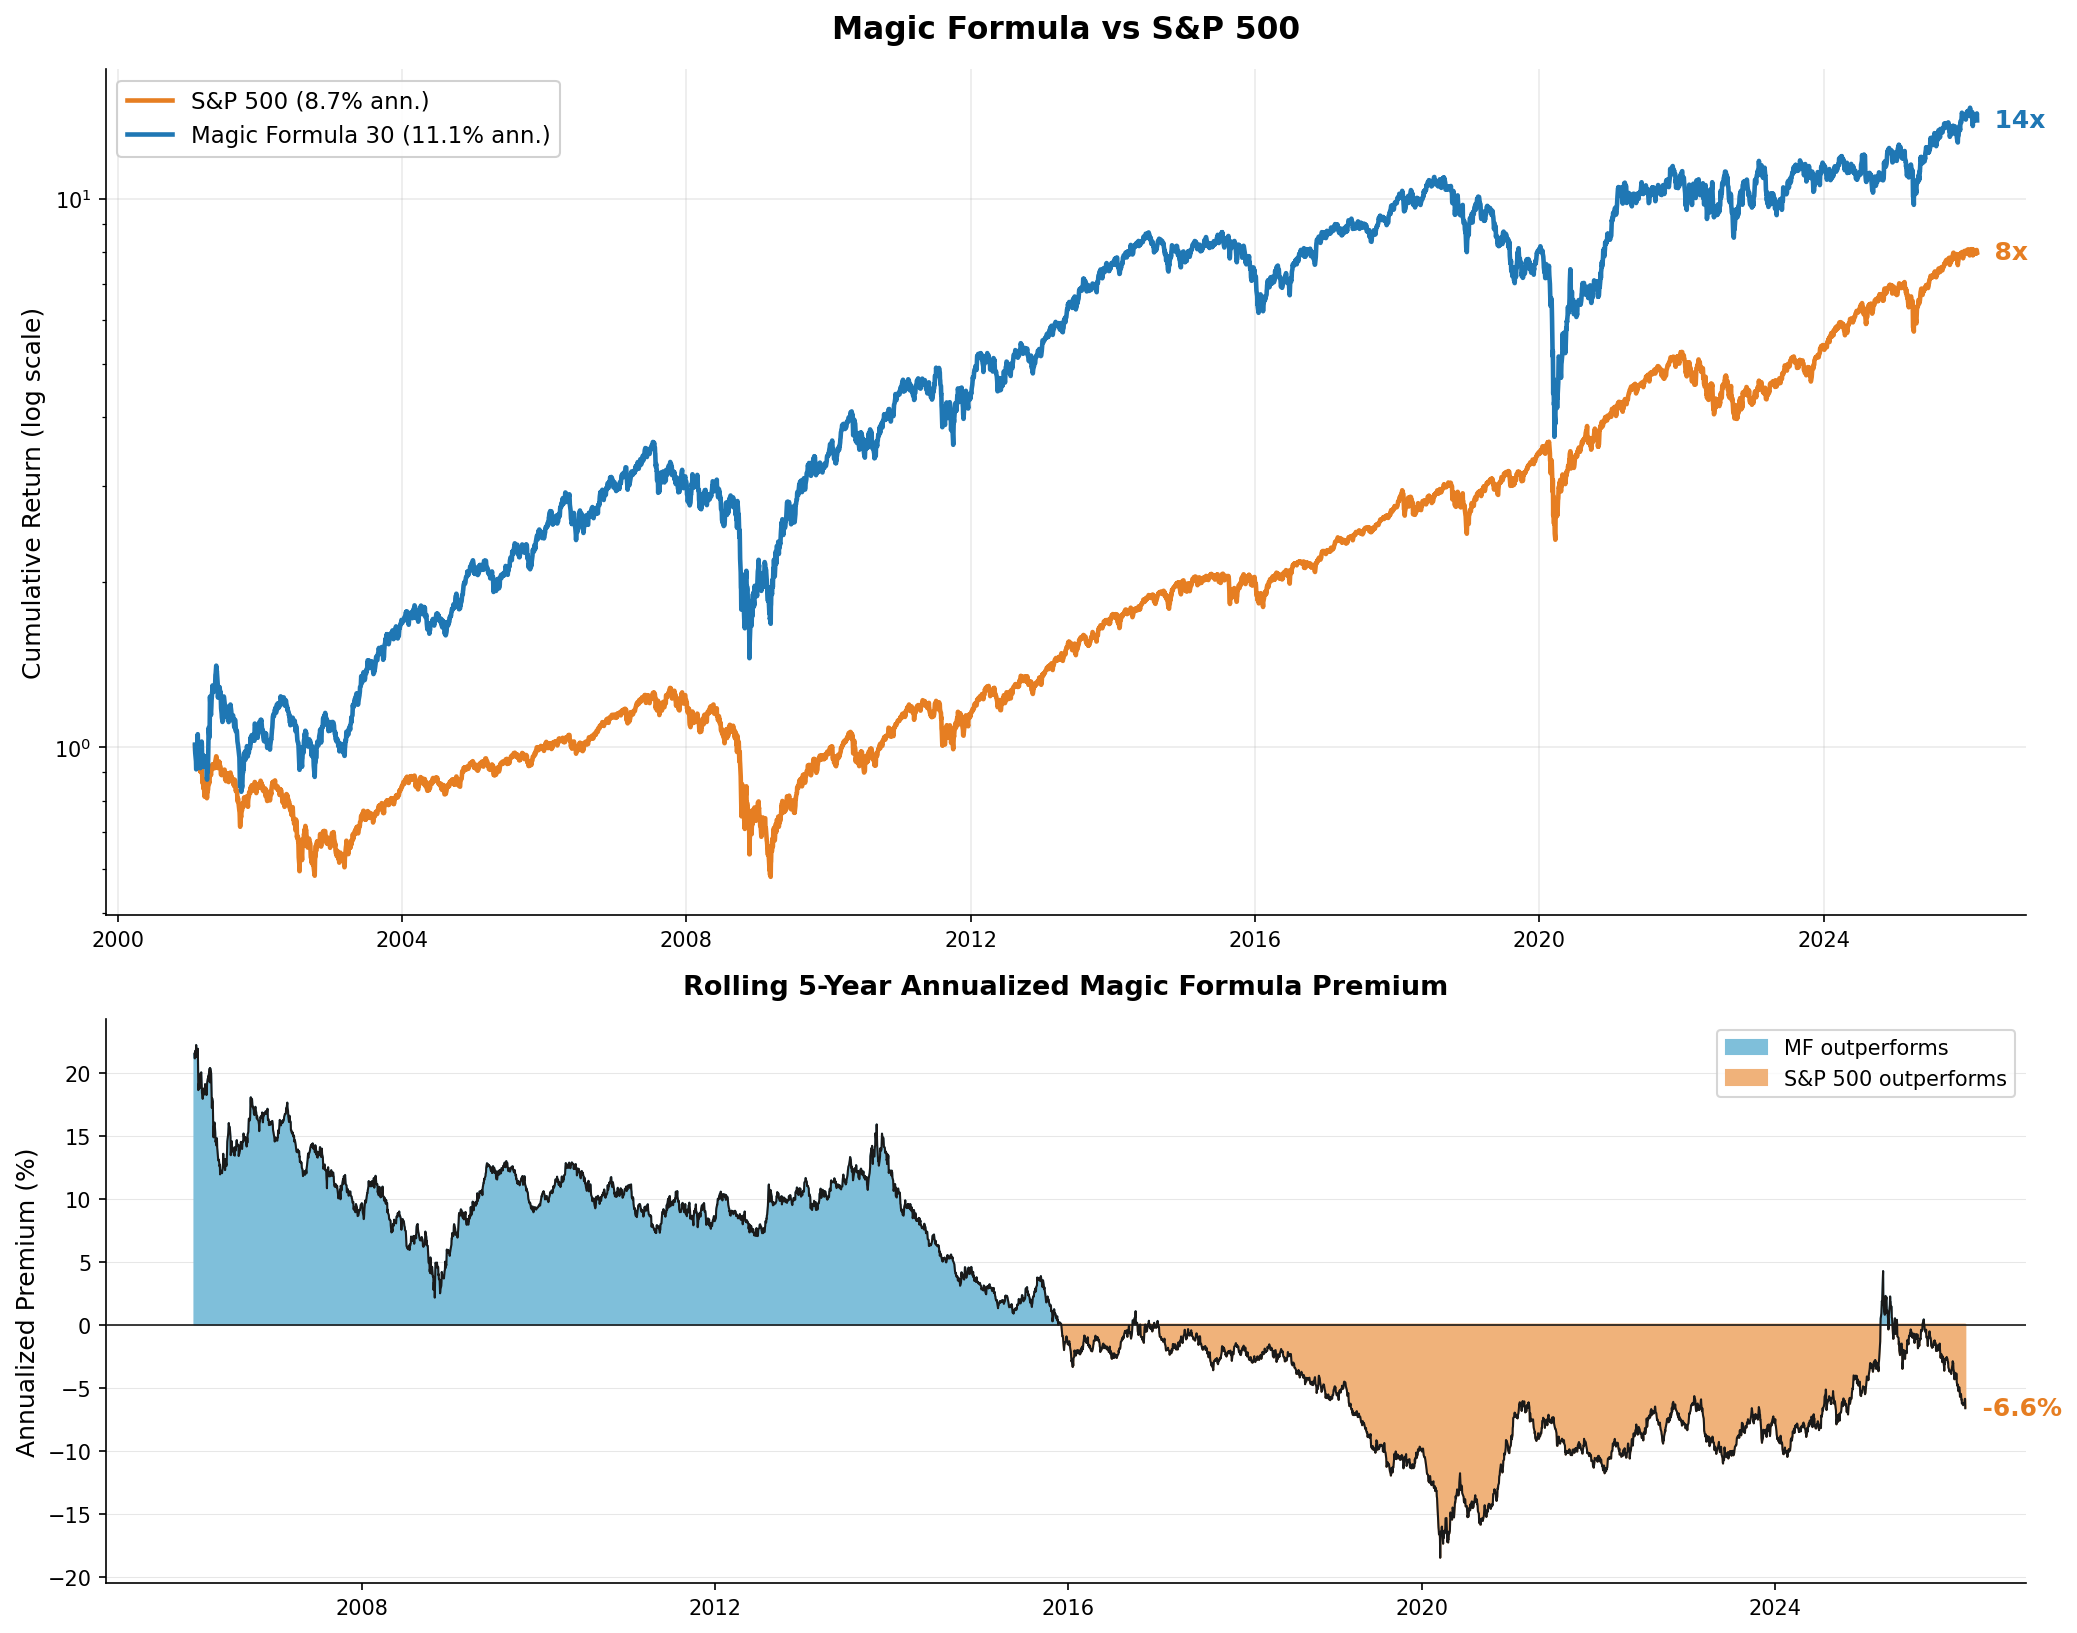
The bottom panel plots the rolling five-year premium of the Magic Formula over the S&P. It is positive, sometimes above 15 points a year, from the start through about 2015. So, the strategy earned the whole 2.4-point annual edge in the first half of the sample. Since then the premium has been negative, and it stands at minus 6.6 points a year now.
Year by year, the Magic Formula beat the S&P in 14 of 26 years, a little better than a coin flip. The average is carried by a handful of large wins early on: plus 25.7 points in 2001, plus 43.3 in 2009. The recent years run the other way, minus 37.0 points in 2019 and minus 19.6 in 2024.
What this test does not settle
One specification. I ran a single version of the formula: EBIT over enterprise value, return on capital, top 30, monthly tranches. The thresholds and the portfolio size are choices, and other reasonable choices give different numbers. This is one path. It does not come with a confidence interval.
Why the edge faded. The test measures that the premium turned negative around 2015. It does not explain why. Value and smaller companies, which the formula tilts toward, have trailed mega-cap growth since then, so part of the fade is that style regime. Whether it comes back is a separate question the backtest cannot answer.
Costs are approximate. The half-spread and a flat commission understate real trading. Slippage past the quoted price is worse in smaller names, which the formula holds, so the true drag is higher than the 0.4% a year charged here.
Return on capital is a proxy. Greenblatt defines it on tangible capital employed. I use the closest field the vendor reports, which is not identical. The ranking is close to his.
What it means
The Magic Formula did beat the market over 25 years, with a mechanical rule that needs no forecasting. Then it stopped around 2015. That is the normal life of a public factor: once an edge is published and easy to run, it gets crowded and its premium fades. The takeaway is that a strategy working over a long sample does not mean it will keep working, because the edge can decay.
Read next
- Avoiding bad companies matters as much as finding great ones The same quality-and-value idea, split into the best US names and the worst.
- Backtests tell you sweet little lies Another published edge, and how much of it survives realistic trading costs.
Disclaimer: simplified, hypothetical backtest with approximate trading costs, for discussion purposes only. Not investment advice. Past performance does not predict future returns.
Data: US equity prices, fundamentals, and bid-ask quotes from LSEG Workspace (licensed). The S&P 500 total-return series is the benchmark. I do not reproduce the raw file here.