Six ways to clean your trading data into the wrong answer
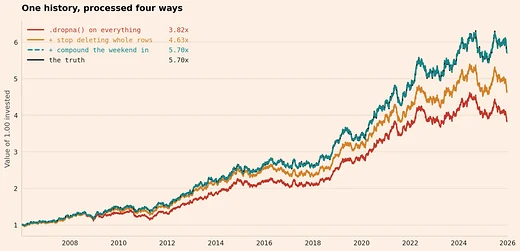
Six ordinary processing steps, each measured against a truth known by construction. One dropna call takes a third off the terminal wealth, and a missing delisting return adds 73.1%.
Backtests, data, and equity strategy ideas. Code when relevant. Readers who want to start from the foundations can use Learn, where Python and R are taught.
Six ordinary processing steps, each measured against a truth known by construction. One dropna call takes a third off the terminal wealth, and a missing delisting return adds 73.1%.
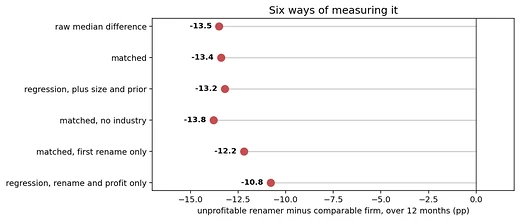
On its own a name change predicts almost nothing. Among firms that were losing money before they renamed, the renamers underperform comparable firms by roughly 13 percentage points over the following year.

On simulated data where the edge is real, the reported return runs from -1.6% to +6.3% a year, depending on eight ordinary portfolio choices.
Six biases that distort quantitative research, each one measured on a simulated market where the truth is known in advance.
On a simulated market with no edge, a researcher who keeps tuning against a hold-out pushes its Sharpe ratio to 2.8, while a final test set opened once stays at zero. An out-of-sample test becomes in-sample the moment we optimise against it.
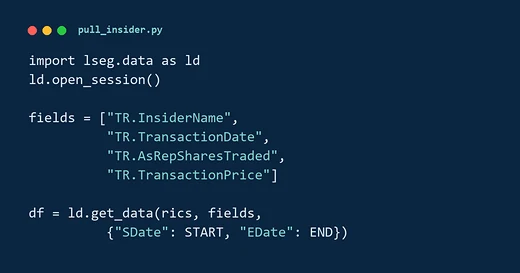
A resumable pipeline for pulling insider transactions for every canonical US stock from LSEG Workspace, chunked by RIC with a retry loop and a field-name probe.
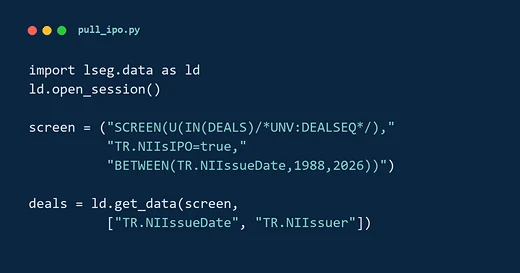
A copy-paste pipeline for pulling every US IPO since 1988 from LSEG's SDC deals database, survivorship-free, then cleaning it to the academic operating-company universe.
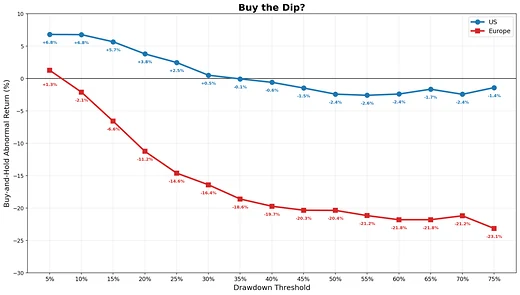
I test buying a stock after its drawdown crosses a threshold and holding 12 months, across the US and 13 European markets. It roughly held in the US and got steadily worse across Europe.
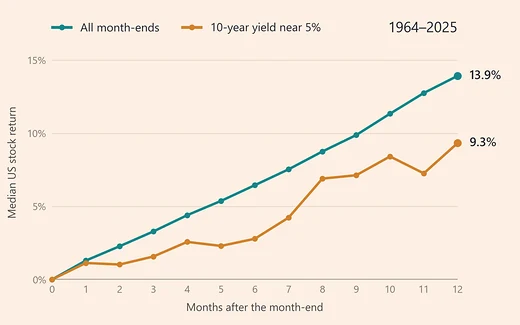
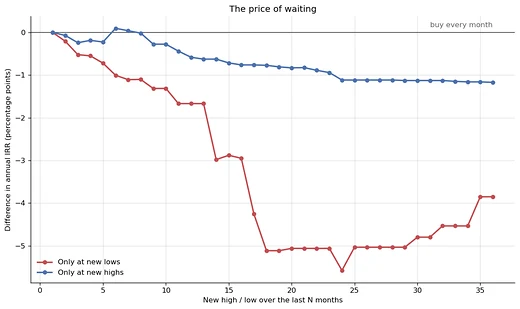
In this post, I show that waiting for new S&P 500 highs or lows usually produced lower returns over ten years than investing every month.
This post shows how to connect Python to Interactive Brokers with ib_async and download historical prices into pandas.
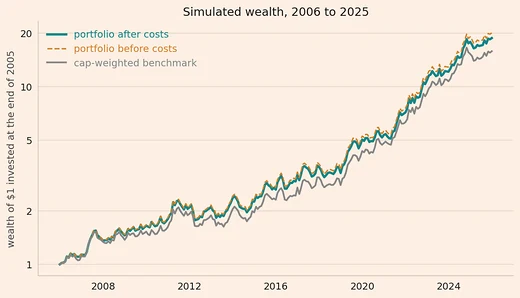
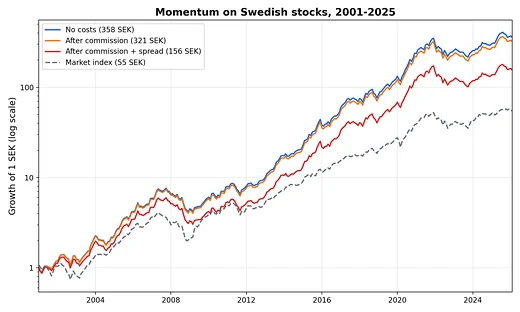
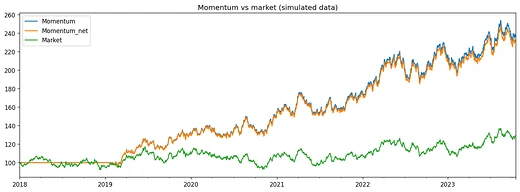
A 25-year Swedish backtest of a 12-2 momentum strategy against the market, with three layers of trading costs. Momentum won before costs, and the bid-ask spread took most of the win.
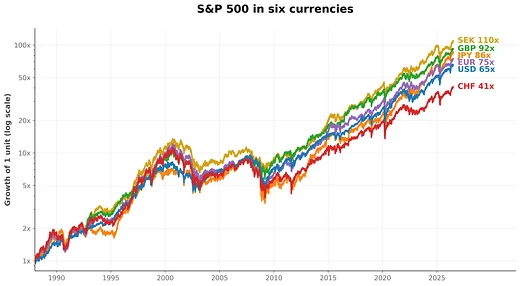
The same S&P 500 total return, 1988 to 2026, converted into six home currencies unhedged, delivered final multiples from 41.1x in Swiss francs to 109.7x in Swedish kronor.
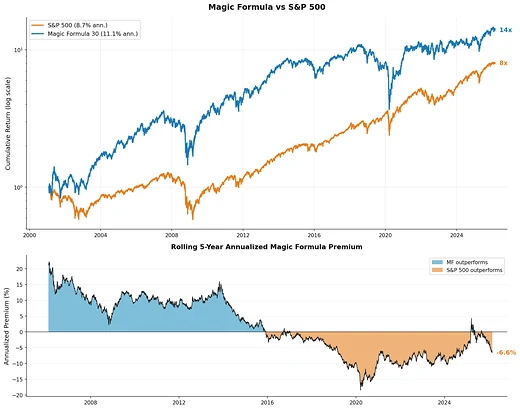
A 25-year US backtest of Greenblatt's Magic Formula against the S&P 500, with trading costs. It beat the market overall, and stopped beating it around 2015.
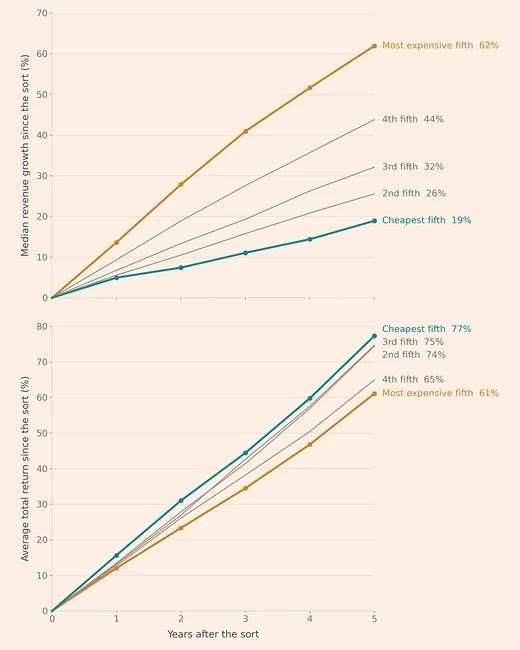
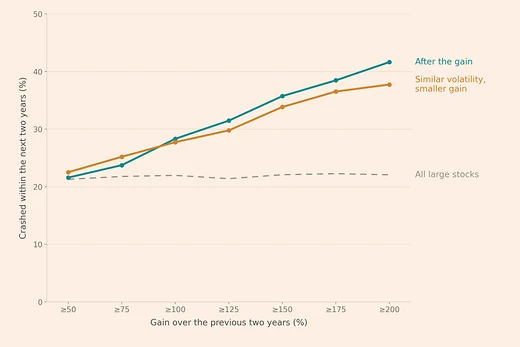
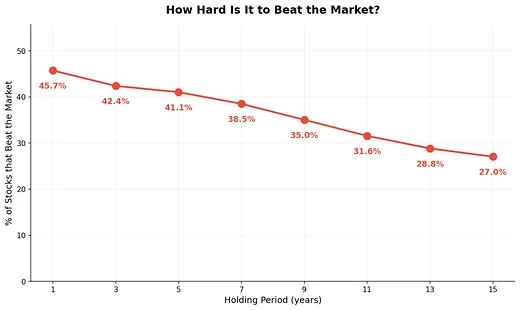
A forward-horizon study of every US stock from 2000 to 2026. At one year nearly half beat the S&P 500, but by 15 years only about one in four did, because a few big winners carry the index.
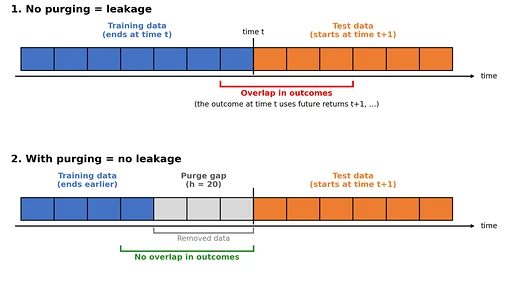
When an outcome spans several future observations, training labels can overlap the test period. This post shows how purging that overlap removes the inflated accuracy.
On a simulated market built to contain no edge, a search across 216 strategies returns a winner with a Sharpe ratio of 0.72. Bootstrapping shows how much of that is precision and how much is the search itself.
Download trade and quote data from LSEG Tick History using Python, with chunked requests, automatic retries and resumable CSV exports.
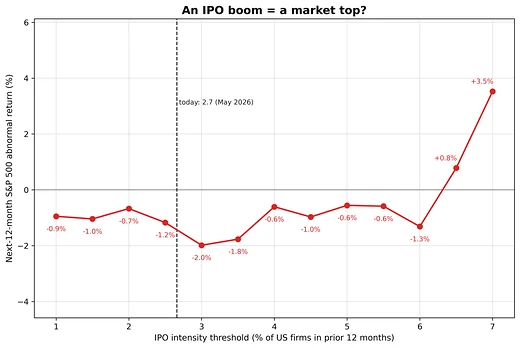
A threshold test over the 1988 to 2025 record: heavy IPO activity did not precede weaker S&P 500 returns. The abnormal return stayed near zero and changed sign.
Two unrelated series can appear highly correlated, even when there is no real relationship between them.
Five rules for focusing your writing and saying more with less.
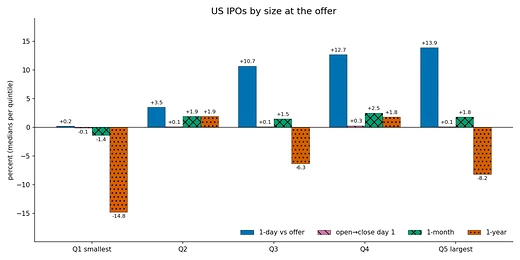
A 26-year study of 2,417 US IPOs sorted by debut size and by valuation. The first-day pop is a size threshold, and among profitable IPOs the first-year return falls straight down the valuation ladder.
A walk-forward test of the chess rating system on four World Cups.
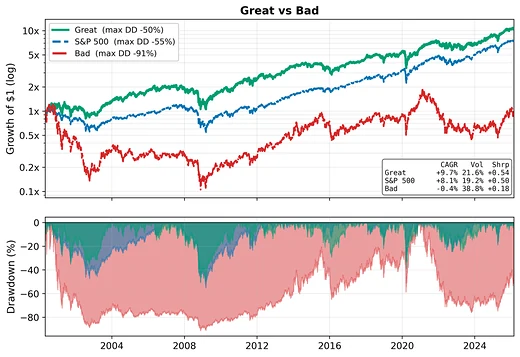
A US backtest of the highest-quality companies against the lowest-quality, equal-weight and net of costs, 2000 to 2026. The best compounded; the worst fell 91%.
A backtest end to end in four steps with the bt library, run on simulated data with a known edge, so it needs no data subscription to reproduce.
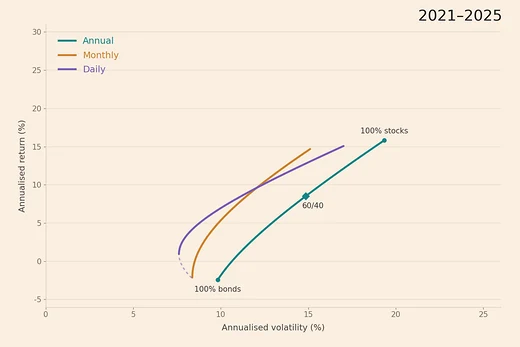
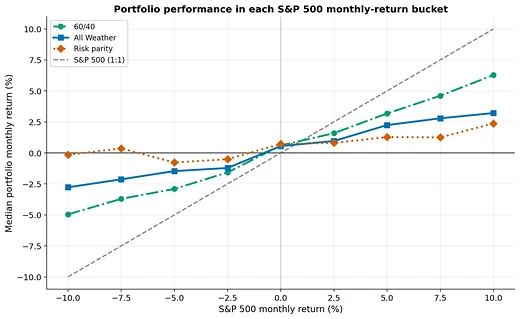
Three portfolios' performance across the full range of S&P 500 monthly returns, 1988 to 2026.
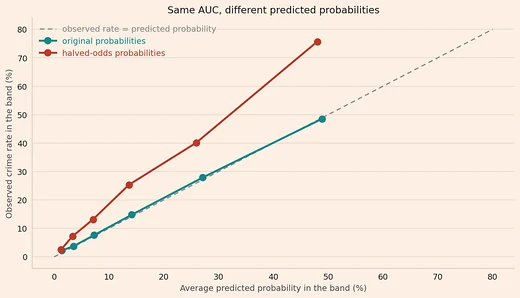
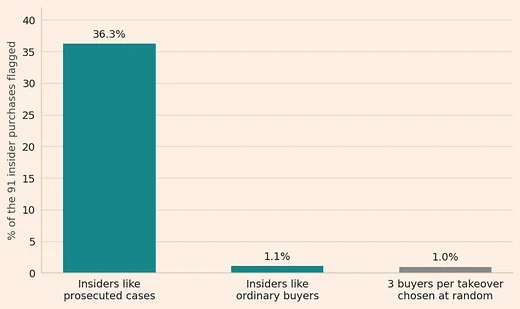
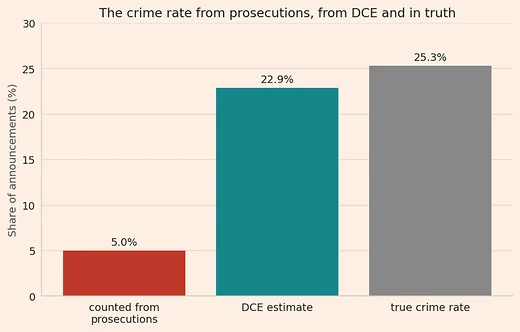
Using Detection-Controlled Estimation to recover hidden market crimes from observed prosecutions.
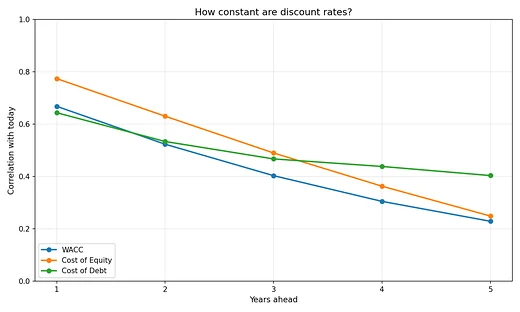
A cross-sectional study of US firms shows WACC persistence is moderate at one year and fades toward noise over five, following Bali, Engle and Murray (2016).
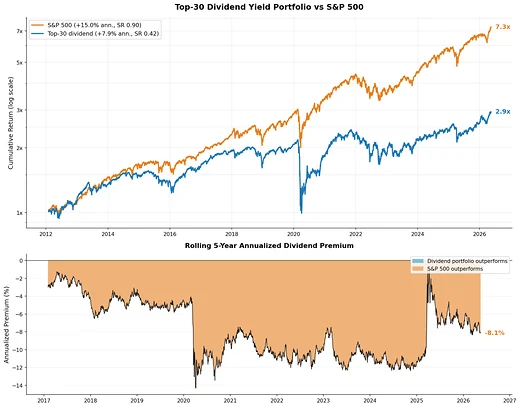
A monthly-rebalanced, equal-weighted portfolio of the top 30 highest-yielding US stocks benchmarked against the S&P 500.
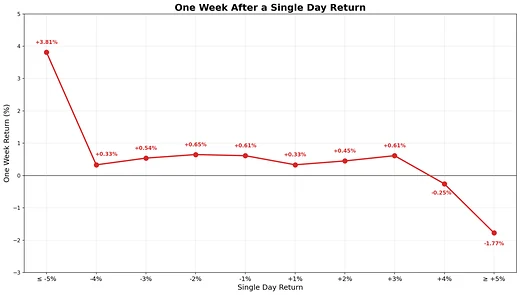
One-week S&P 500 total-return outcomes after large single-day moves, 1988 to 2026.
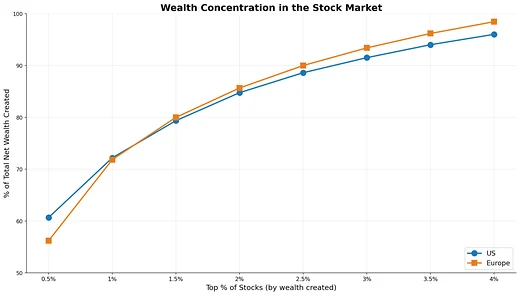
A replication of Bessembinder (2018) on US and European stocks, 2000 to 2026. The top 5.4% of US stocks and 4.4% of European stocks account for all the net wealth created.
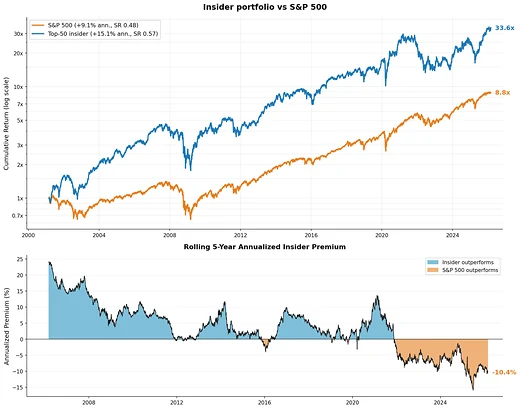
A monthly-rebalanced, equal-weighted portfolio of the largest net-dollar insider buyers benchmarked against the S&P 500.
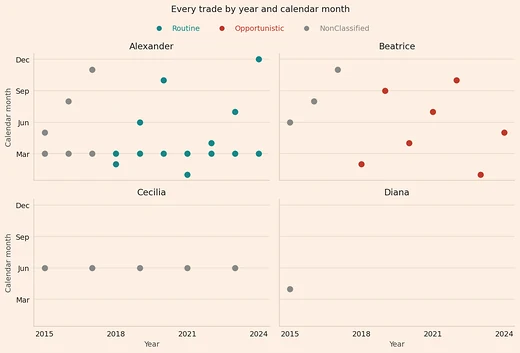
Classifying insiders as informed according to Cohen, Malloy & Pomorski (2012) routine/opportunistic insider split.
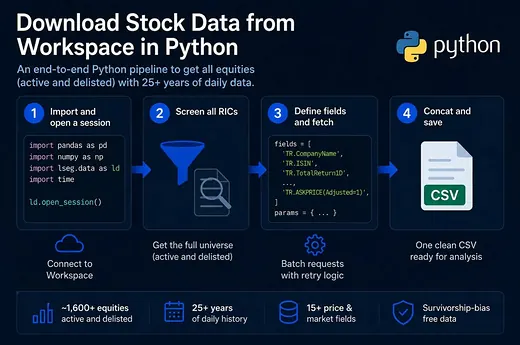
A copy-paste pipeline for pulling every Swedish stock since 2000, active and delisted, into one CSV.